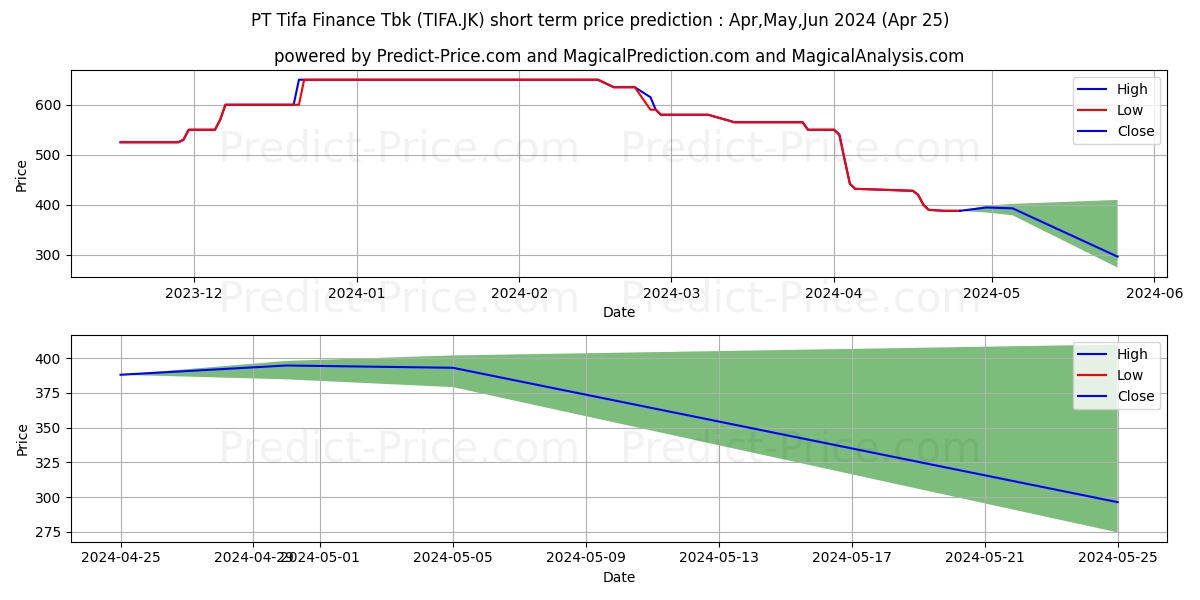
Maximum and minimum KDB Tifa Finance Tbk. short-term price forecast for May,Jun,Jul 2024

KDB Tifa Finance Tbk. stock short term price prediction: May,Jun,Jul 2024|TIFA.JK: 669.0876827239990234375000000000000
Period Action Trend Status Action & Trend & Status Ceiling price Floor price Ceiling & Floor
5 Days Neutral Uptrend 83.4% Neutral 1.71% Neutral

Uptrend:83.4%

Neutral:1.71%
397.9430698394775163251324556767941 384.7097112417221183022775221616030 397.9430698394775163251324556767941
384.7097112417221183022775221616030
10 Days Neutral Uptrend 78.99% Neutral 1.29% Neutral

Uptrend:78.99%

Neutral:1.29%
401.8663175106048583984375000000000 379.1390978813171273031912278383970 401.8663175106048583984375000000000
379.1390978813171273031912278383970
30 Days Neutral Uptrend 71.22% Loss -23.6% Neutral

Uptrend:71.22%

Loss:-23.6%
409.7040293693542594155587721616030 274.7374427318572998046875000000000 409.7040293693542594155587721616030
274.7374427318572998046875000000000

KDB Tifa Finance Tbk. (TIFA.JK) stock price prediction for the next 5 days on 25 Apr 2024

5-Day prediction shows that the price will grow by 83.4% probability and have a downward trend by 0% probability. Moreover, the probability that KDB Tifa Finance Tbk. (TIFA.JK) price has no a definite trend is 16.6% (The price fluctuation will be experienced). So, KDB Tifa Finance Tbk. (TIFA.JK) price is expected to rise in the next 5 days. In the 5-day price prediction, KDB Tifa Finance Tbk. (TIFA.JK) price will reach 397.9430698394775163251324556767941 and 384.7097112417221183022775221616030 in the best and worst conditions respectively.

Note! All of the predictions are based on daily price changes and none of other external effects such as news, companies’ situations, and different events are not taken into account. So, you really need to consider all factors before you make any decision. (choose the best option by considering all factors) Please pay attention to the predition dates and the validity range of the predicted prices.

The final result of the 5-day KDB Tifa Finance Tbk. (TIFA.JK) predictions demonstrate that:

This prediction will be valid by Apr 30, 2024 if the real price is between 417.8402233314513978257309645414352 and 365.4742256796359924919670447707176

There will be an upward trend and 1.71% profit. Moreover, the price will be around 397.9430698394775163251324556767941. So, it is suggested that buy it more carefully.

Useful Tips: To make the most informed decisions about investing in KDB Tifa Finance Tbk. (TIFA.JK), we highly recommend visiting the 'MagicalAnalysis' and 'MgicalPrediction' websites. They also provide signals for free. 'MagicalAnalysis' provides signals based on technical analysis and various strategies for free. 'MgicalPrediction' provides signals based on various AI models for free.

Forecast charts of the KDB Tifa Finance Tbk. (TIFA.JK) stock prices in the next 5 days

Price trend prediction of KDB Tifa Finance Tbk. (TIFA.JK) stock for the next 5 days

Strong Uptrend 83.4%

KDB Tifa Finance Tbk. (TIFA.JK) stock profit and loss prediction for the next 5 days

Neutral 1.71%

Forecast chart of the highest and lowest KDB Tifa Finance Tbk. (TIFA.JK) stock prices in the next 5 days

KDB Tifa Finance Tbk. (TIFA.JK) stock price prediction for the next 10 days on 25 Apr 2024

10-Day prediction shows that the price will grow by 78.99% probability and have a downward trend by 0% probability. Moreover, the probability that KDB Tifa Finance Tbk. (TIFA.JK) price has no a definite trend is 21.01% (The price fluctuation will be experienced). So, KDB Tifa Finance Tbk. (TIFA.JK) price is expected to rise in the next 10 days. In the 10-day price prediction, KDB Tifa Finance Tbk. (TIFA.JK) price will reach 401.8663175106048583984375000000000 and 379.1390978813171273031912278383970 in the best and worst conditions respectively.

Note! All of the predictions are based on daily price changes and none of other external effects such as news, companies’ situations, and different events are not taken into account. So, you really need to consider all factors before you make any decision. (choose the best option by considering all factors) Please pay attention to the predition dates and the validity range of the predicted prices.

The final result of the 10-day KDB Tifa Finance Tbk. (TIFA.JK) predictions demonstrate that:

This prediction will be valid by May 05, 2024 if the real price is between 421.9596333861351240557269193232059 and 360.1821429872512680958607234060764

There will be an upward trend and 1.29% profit. Moreover, the price will be around 401.8663175106048583984375000000000. So, it is suggested that buy it more carefully.

Useful Tips: To make the most informed decisions about investing in KDB Tifa Finance Tbk. (TIFA.JK), we highly recommend visiting the 'MagicalAnalysis' and 'MgicalPrediction' websites. They also provide signals for free. 'MagicalAnalysis' provides signals based on technical analysis and various strategies for free. 'MgicalPrediction' provides signals based on various AI models for free.

Forecast charts of the KDB Tifa Finance Tbk. (TIFA.JK) stock prices in the next 10 days

Price trend prediction of KDB Tifa Finance Tbk. (TIFA.JK) stock for the next 10 days

Strong Uptrend 78.99%

KDB Tifa Finance Tbk. (TIFA.JK) stock profit and loss prediction for the next 10 days

Neutral 1.29%

Forecast chart of the highest and lowest KDB Tifa Finance Tbk. (TIFA.JK) stock prices in the next 10 days

KDB Tifa Finance Tbk. (TIFA.JK) stock price prediction for the next 30 days on 25 Apr 2024

30-Day prediction shows that the price will grow by 71.22% probability and have a downward trend by 0% probability. Moreover, the probability that KDB Tifa Finance Tbk. (TIFA.JK) price has no a definite trend is 28.78% (The price fluctuation will be experienced). So, KDB Tifa Finance Tbk. (TIFA.JK) price is expected to rise in the next 30 days. In the 30-day price prediction, KDB Tifa Finance Tbk. (TIFA.JK) price will reach 409.7040293693542594155587721616030 and 274.7374427318572998046875000000000 in the best and worst conditions respectively.

Note! All of the predictions are based on daily price changes and none of other external effects such as news, companies’ situations, and different events are not taken into account. So, you really need to consider all factors before you make any decision. (choose the best option by considering all factors) Please pay attention to the predition dates and the validity range of the predicted prices.

The final result of the 30-day KDB Tifa Finance Tbk. (TIFA.JK) predictions demonstrate that:

This prediction will be valid by May 25, 2024 if the real price is between 430.1892308378219809128495398908854 and 261.0005705952644348144531250000000

Although, there will be an upward trend, -23.6% loss is observed. Moreover, the price will be around 274.7374427318572998046875000000000. So, it is suggested that do not buy it because of the high risk of the trade.

Useful Tips: To make the most informed decisions about investing in KDB Tifa Finance Tbk. (TIFA.JK), we highly recommend visiting the 'MagicalAnalysis' and 'MgicalPrediction' websites. They also provide signals for free. 'MagicalAnalysis' provides signals based on technical analysis and various strategies for free. 'MgicalPrediction' provides signals based on various AI models for free.

Forecast charts of the KDB Tifa Finance Tbk. (TIFA.JK) stock prices in the next 30 days

Price trend prediction of KDB Tifa Finance Tbk. (TIFA.JK) stock for the next 30 days

Strong Uptrend 71.22%

KDB Tifa Finance Tbk. (TIFA.JK) stock profit and loss prediction for the next 30 days

Strong Loss -23.6%

Forecast chart of the highest and lowest KDB Tifa Finance Tbk. (TIFA.JK) stock prices in the next 30 days

Users forecasts for KDB Tifa Finance Tbk. (TIFA.JK)

What is your prediction?

In this section, you can easily predict without user registration. See also other users predictions.

KDB Tifa Finance Tbk. (TIFA.JK) predictions by visitors

KDB Tifa Finance Tbk. (TIFA.JK) predictions by visitors

Please enter your name correctly.
Please enter your email correctly
Please enter your text.