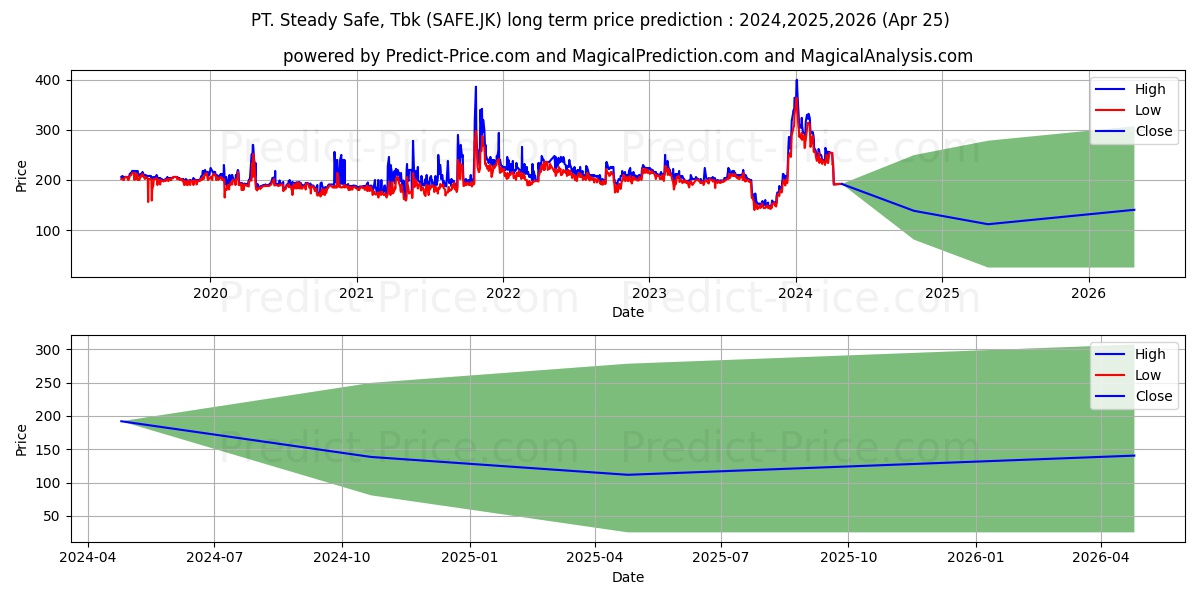
Maximum and minimum Steady Safe Tbk long-term price forecast for 2024,2025,2026

Steady Safe Tbk stock long term price prediction: 2024,2025,2026|SAFE.JK: 332.7239
Period Action Trend Status Action & Trend & Status Ceiling price Floor price Ceiling & Floor
6 Months Sell Downtrend -21.72% Loss -27.88% Sell

Downtrend:-21.72%

Loss:-27.88%
332.7239379882812500000000000000000 98.6239210367202758789062500000000 332.7239379882812500000000000000000
98.6239210367202758789062500000000
1 Year Neutral Neutral -11.55% Loss -41.82% Neutral

Neutral:-11.55%

Loss:-41.82%
371.0859069824218750000000000000000 30.9358815550804138183593750000000 371.0859069824218750000000000000000
30.9358815550804138183593750000000
2 Years Neutral Neutral 9.21% Loss -26.84% Neutral

Neutral:9.21%

Loss:-26.84%
409.4478759765625000000000000000000 30.9358815550804138183593750000000 409.4478759765625000000000000000000
30.9358815550804138183593750000000

Steady Safe Tbk (SAFE.JK) stock price prediction until 25 Oct 2024 (update date: 25 Apr 2024)

Forecast until 25 Oct 2024 shows that the price will grow by 0% probability and have a downward trend by 21.72% probability. Moreover, the probability that Steady Safe Tbk (SAFE.JK) price has no a definite trend is 78.28% (The price fluctuation will be experienced). So, Steady Safe Tbk (SAFE.JK) price is expected to be neutral in the next 6 Months. In the forecast until 25 Oct 2024, Steady Safe Tbk (SAFE.JK) price will reach 324.9257206916809082031250000000000 and 105.3674370050430297851562500000000 in the best and worst conditions respectively.

Note! All of the predictions are based on daily price changes and none of other external effects such as news, companies’ situations, and different events are not taken into account. So, you really need to consider all factors before you make any decision. (choose the best option by considering all factors) Please pay attention to the predition dates and the validity range of the predicted prices.

The final result of the predictions until 25 Oct 2024 for Steady Safe Tbk (SAFE.JK) shows that:

This prediction will be valid by 25 Oct 2024 if the real price is between 341.1720067262649536132812500000000 and 100.0990651547908782958984375000000

There wil be a neutral trend and meanwhile -27.88% loss. Moreover, the price will be around . So, it is suggested that sell it more carefully.

Useful Tips: To make the most informed decisions about investing in Steady Safe Tbk (SAFE.JK), we highly recommend visiting the 'MagicalAnalysis' and 'MgicalPrediction' websites. They also provide signals for free. 'MagicalAnalysis' provides signals based on technical analysis and various strategies for free. 'MgicalPrediction' provides signals based on various AI models for free.

Steady Safe Tbk (SAFE.JK) stock price forecast charts until 25 Oct 2024

Steady Safe Tbk (SAFE.JK) stock profit and loss prediction until 25 Oct 2024

Neutral -21.72%

Steady Safe Tbk (SAFE.JK) stock profit and loss prediction for the next 25 days

Strong Loss -27.88%

The prediction chart of the highest and lowest price of Steady Safe Tbk (SAFE.JK) stock until 25 Oct 2024 Forecast chart of the highest and lowest 25 Apr 2024

Steady Safe Tbk (SAFE.JK) stock price prediction until 25 Apr 2025 (update date: 25 Apr 2024)

Forecast until 25 Apr 2025 shows that the price will grow by 0% probability and have a downward trend by 11.55% probability. Moreover, the probability that Steady Safe Tbk (SAFE.JK) price has no a definite trend is 88.45% (The price fluctuation will be experienced). So, Steady Safe Tbk (SAFE.JK) price is expected to be neutral in the next 12 Months. In the forecast until 25 Apr 2025, Steady Safe Tbk (SAFE.JK) price will reach 362.3885810375213623046875000000000 and 33.0511555075645446777343750000000 in the best and worst conditions respectively.

Note! All of the predictions are based on daily price changes and none of other external effects such as news, companies’ situations, and different events are not taken into account. So, you really need to consider all factors before you make any decision. (choose the best option by considering all factors) Please pay attention to the predition dates and the validity range of the predicted prices.

The final result of the predictions until 25 Apr 2025 for Steady Safe Tbk (SAFE.JK) shows that:

This prediction will be valid by 25 Apr 2025 if the real price is between 380.5080100893974304199218750000000 and -1.6525577753782272338867187500000

There wil be a neutral trend and meanwhile -41.82% loss. Moreover, the price will be around 33.0511555075645446777343750000000. So, it is suggested that sell it more carefully.

Useful Tips: To make the most informed decisions about investing in Steady Safe Tbk (SAFE.JK), we highly recommend visiting the 'MagicalAnalysis' and 'MgicalPrediction' websites. They also provide signals for free. 'MagicalAnalysis' provides signals based on technical analysis and various strategies for free. 'MgicalPrediction' provides signals based on various AI models for free.

Steady Safe Tbk (SAFE.JK) stock price forecast charts until 25 Apr 2025

Steady Safe Tbk (SAFE.JK) stock profit and loss prediction until 25 Apr 2025

Neutral -11.55%

Steady Safe Tbk (SAFE.JK) stock profit and loss prediction for the next 25 days

Strong Loss -41.82%

The prediction chart of the highest and lowest price of Steady Safe Tbk (SAFE.JK) stock until 25 Apr 2025 Forecast chart of the highest and lowest 25 Apr 2024

Steady Safe Tbk (SAFE.JK) stock price prediction until 25 Apr 2026 (update date: 25 Apr 2024)

Forecast until 25 Apr 2026 shows that the price will grow by 9.21% probability and have a downward trend by 0% probability. Moreover, the probability that Steady Safe Tbk (SAFE.JK) price has no a definite trend is 90.79% (The price fluctuation will be experienced). So, Steady Safe Tbk (SAFE.JK) price is expected to be neutral in the next 24 Months. In the forecast until 25 Apr 2026, Steady Safe Tbk (SAFE.JK) price will reach 399.8514413833618164062500000000000 and 30.9358815550804138183593750000000 in the best and worst conditions respectively.

Note! All of the predictions are based on daily price changes and none of other external effects such as news, companies’ situations, and different events are not taken into account. So, you really need to consider all factors before you make any decision. (choose the best option by considering all factors) Please pay attention to the predition dates and the validity range of the predicted prices.

The final result of the predictions until 25 Apr 2026 for Steady Safe Tbk (SAFE.JK) shows that:

This prediction will be valid by 25 Apr 2026 if the real price is between 419.8440134525299072265625000000000 and 29.3890874773263917063559347297996

There wil be a neutral trend and meanwhile -26.84% loss. Moreover, the price will be around 33.0511555075645446777343750000000. So, it is suggested that sell it more carefully.

Useful Tips: To make the most informed decisions about investing in Steady Safe Tbk (SAFE.JK), we highly recommend visiting the 'MagicalAnalysis' and 'MgicalPrediction' websites. They also provide signals for free. 'MagicalAnalysis' provides signals based on technical analysis and various strategies for free. 'MgicalPrediction' provides signals based on various AI models for free.

Steady Safe Tbk (SAFE.JK) stock price forecast charts until 25 Apr 2026

Steady Safe Tbk (SAFE.JK) stock profit and loss prediction until 25 Apr 2026

Neutral 9.21%

Steady Safe Tbk (SAFE.JK) stock profit and loss prediction for the next 25 days

Strong Loss -26.84%

The prediction chart of the highest and lowest price of Steady Safe Tbk (SAFE.JK) stock until 25 Apr 2026 Forecast chart of the highest and lowest 25 Apr 2024

Users forecasts for Steady Safe Tbk (SAFE.JK)

What is your prediction?

In this section, you can easily predict without user registration. See also other users predictions.

Steady Safe Tbk (SAFE.JK) predictions by visitors

Steady Safe Tbk (SAFE.JK) predictions by visitors

Please enter your name correctly.
Please enter your email correctly
Please enter your text.