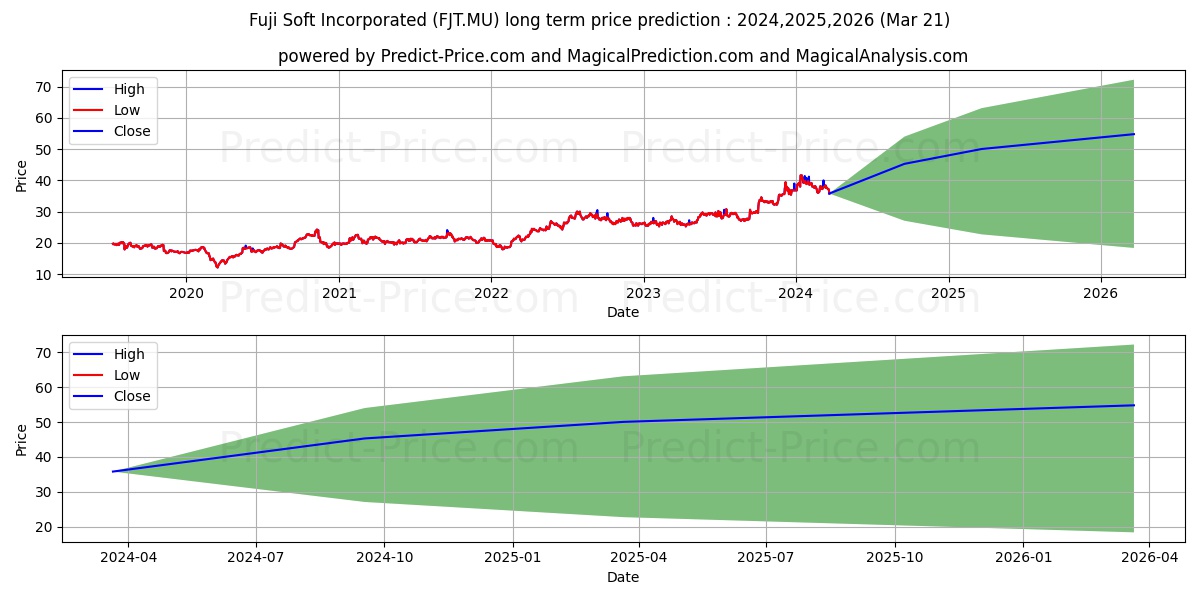
Maximum and minimum FUJI SOFT INC. long-term price forecast for 2024,2025,2026

FUJI SOFT INC. stock long term price prediction: 2024,2025,2026|FJT.MU: 59.1427
Period Action Trend Status Action & Trend & Status Ceiling price Floor price Ceiling & Floor
6 Months Neutral Downtrend -20.95% Profit 26.53% Neutral

Downtrend:-20.95%

Profit:26.53%
59.14 29.66 59.14
29.66
1 Year Buy Uptrend 27.72% Profit 39.8% Buy

Uptrend:27.72%

Profit:39.8%
69.11 24.89 69.11
24.89
2 Years Neutral Neutral 9.9% Profit 53.07% Neutral

Neutral:9.9%

Profit:53.07%
79.09 20.12 79.09
20.12

FUJI SOFT INC. (FJT.MU) stock price prediction until 21 Sep 2024 (update date: 21 Mar 2024)

Forecast until 21 Sep 2024 shows that the price will grow by 0% probability and have a downward trend by 20.95% probability. Moreover, the probability that FUJI SOFT INC. (FJT.MU) price has no a definite trend is 79.05% (The price fluctuation will be experienced). So, FUJI SOFT INC. (FJT.MU) price is expected to be neutral in the next 6 Months. In the forecast until 21 Sep 2024, FUJI SOFT INC. (FJT.MU) price will reach 59.14 and 29.66 in the best and worst conditions respectively.

Note! All of the predictions are based on daily price changes and none of other external effects such as news, companies’ situations, and different events are not taken into account. So, you really need to consider all factors before you make any decision. (choose the best option by considering all factors) Please pay attention to the predition dates and the validity range of the predicted prices.

The final result of the predictions until 21 Sep 2024 for FUJI SOFT INC. (FJT.MU) shows that:

This prediction will be valid by 21 Sep 2024 if the real price is between 62.10 and 28.18

There will be a neutral trend and meanwhile 26.53% profit. Moreover, the price will be around . So, it is suggested that buy it more carefully.

Useful Tips: To make the most informed decisions about investing in FUJI SOFT INC. (FJT.MU), we highly recommend visiting the 'MagicalAnalysis' and 'MgicalPrediction' websites. They also provide signals for free. 'MagicalAnalysis' provides signals based on technical analysis and various strategies for free. 'MgicalPrediction' provides signals based on various AI models for free.

FUJI SOFT INC. (FJT.MU) stock price forecast charts until 21 Sep 2024

FUJI SOFT INC. (FJT.MU) stock profit and loss prediction until 21 Sep 2024

Neutral -20.95%

FUJI SOFT INC. (FJT.MU) stock profit and loss prediction for the next 21 days

Strong Profit 26.53%

The prediction chart of the highest and lowest price of FUJI SOFT INC. (FJT.MU) stock until 21 Sep 2024 Forecast chart of the highest and lowest 21 Mar 2024

FUJI SOFT INC. (FJT.MU) stock price prediction until 21 Mar 2025 (update date: 21 Mar 2024)

Forecast until 21 Mar 2025 shows that the price will grow by 27.72% probability and have a downward trend by 0% probability. Moreover, the probability that FUJI SOFT INC. (FJT.MU) price has no a definite trend is 72.28% (The price fluctuation will be experienced). So, FUJI SOFT INC. (FJT.MU) price is expected to be neutral in the next 12 Months. In the forecast until 21 Mar 2025, FUJI SOFT INC. (FJT.MU) price will reach 69.11 and 24.89 in the best and worst conditions respectively.

Note! All of the predictions are based on daily price changes and none of other external effects such as news, companies’ situations, and different events are not taken into account. So, you really need to consider all factors before you make any decision. (choose the best option by considering all factors) Please pay attention to the predition dates and the validity range of the predicted prices.

The final result of the predictions until 21 Mar 2025 for FUJI SOFT INC. (FJT.MU) shows that:

This prediction will be valid by 21 Mar 2025 if the real price is between 72.57 and -1.24

There will be a neutral trend and meanwhile 39.8% profit. Moreover, the price will be around 69.11. So, it is suggested that buy it more carefully.

Useful Tips: To make the most informed decisions about investing in FUJI SOFT INC. (FJT.MU), we highly recommend visiting the 'MagicalAnalysis' and 'MgicalPrediction' websites. They also provide signals for free. 'MagicalAnalysis' provides signals based on technical analysis and various strategies for free. 'MgicalPrediction' provides signals based on various AI models for free.

FUJI SOFT INC. (FJT.MU) stock price forecast charts until 21 Mar 2025

FUJI SOFT INC. (FJT.MU) stock profit and loss prediction until 21 Mar 2025

Neutral 27.72%

FUJI SOFT INC. (FJT.MU) stock profit and loss prediction for the next 21 days

Strong Profit 39.8%

The prediction chart of the highest and lowest price of FUJI SOFT INC. (FJT.MU) stock until 21 Mar 2025 Forecast chart of the highest and lowest 21 Mar 2024

FUJI SOFT INC. (FJT.MU) stock price prediction until 21 Mar 2026 (update date: 21 Mar 2024)

Forecast until 21 Mar 2026 shows that the price will grow by 9.9% probability and have a downward trend by 0% probability. Moreover, the probability that FUJI SOFT INC. (FJT.MU) price has no a definite trend is 90.1% (The price fluctuation will be experienced). So, FUJI SOFT INC. (FJT.MU) price is expected to be neutral in the next 24 Months. In the forecast until 21 Mar 2026, FUJI SOFT INC. (FJT.MU) price will reach 79.09 and 20.12 in the best and worst conditions respectively.

Note! All of the predictions are based on daily price changes and none of other external effects such as news, companies’ situations, and different events are not taken into account. So, you really need to consider all factors before you make any decision. (choose the best option by considering all factors) Please pay attention to the predition dates and the validity range of the predicted prices.

The final result of the predictions until 21 Mar 2026 for FUJI SOFT INC. (FJT.MU) shows that:

This prediction will be valid by 21 Mar 2026 if the real price is between 83.04 and 19.11

There will be a neutral trend and meanwhile 53.07% profit. Moreover, the price will be around 79.09. So, it is suggested that buy it more carefully.

Useful Tips: To make the most informed decisions about investing in FUJI SOFT INC. (FJT.MU), we highly recommend visiting the 'MagicalAnalysis' and 'MgicalPrediction' websites. They also provide signals for free. 'MagicalAnalysis' provides signals based on technical analysis and various strategies for free. 'MgicalPrediction' provides signals based on various AI models for free.

FUJI SOFT INC. (FJT.MU) stock price forecast charts until 21 Mar 2026

FUJI SOFT INC. (FJT.MU) stock profit and loss prediction until 21 Mar 2026

Neutral 9.9%

FUJI SOFT INC. (FJT.MU) stock profit and loss prediction for the next 21 days

Strong Profit 53.07%

The prediction chart of the highest and lowest price of FUJI SOFT INC. (FJT.MU) stock until 21 Mar 2026 Forecast chart of the highest and lowest 21 Mar 2024

Users forecasts for FUJI SOFT INC. (FJT.MU)

What is your prediction?

In this section, you can easily predict without user registration. See also other users predictions.

FUJI SOFT INC. (FJT.MU) predictions by visitors

FUJI SOFT INC. (FJT.MU) predictions by visitors

Please enter your name correctly.
Please enter your email correctly
Please enter your text.