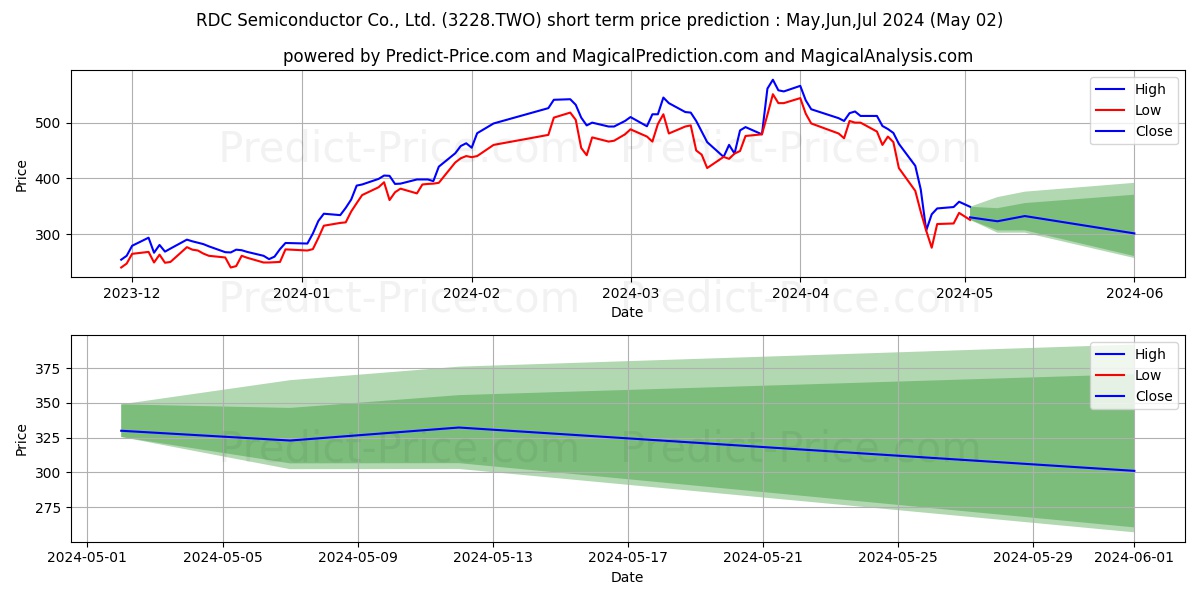
Maximum and minimum RDC SEMICONDUCTOR CO short-term price forecast for May,Jun,Jul 2024

RDC SEMICONDUCTOR CO stock short term price prediction: May,Jun,Jul 2024|3228.TWO: 864.5374792098998568690149113535881
Period Action Trend Status Action & Trend & Status Ceiling price Floor price Ceiling & Floor
5 Days Sell Downtrend -51.22% Loss -6.41% Sell

Downtrend:-51.22%

Loss:-6.41%
351.9330771684646492758474778383970 244.3421640038490352253575110808015 351.9330771684646492758474778383970
244.3421640038490352253575110808015
10 Days Neutral Neutral -14.47% Loss -6.51% Neutral

Neutral:-14.47%

Loss:-6.51%
354.9983042478561401367187500000000 241.5450170040130615234375000000000 354.9983042478561401367187500000000
241.5450170040130615234375000000000
30 Days Neutral Neutral -7.79% Loss -10.09% Neutral

Neutral:-7.79%

Loss:-10.09%
367.4986449360847586831368971616030 221.4348679333925247192382812500000 367.4986449360847586831368971616030
221.4348679333925247192382812500000

RDC SEMICONDUCTOR CO (3228.TWO) stock price prediction for the next 5 days on 25 Apr 2024

5-Day prediction shows that the price will grow by 0% probability and have a downward trend by 51.22% probability. Moreover, the probability that RDC SEMICONDUCTOR CO (3228.TWO) price has no a definite trend is 48.78% (The price fluctuation will be experienced). So, RDC SEMICONDUCTOR CO (3228.TWO) price is expected to fall in the next 5 days. In the 5-day price prediction, RDC SEMICONDUCTOR CO (3228.TWO) price will reach 351.9330771684646492758474778383970 and 297.5564283967017900067730806767941 in the best and worst conditions respectively.

Note! All of the predictions are based on daily price changes and none of other external effects such as news, companies’ situations, and different events are not taken into account. So, you really need to consider all factors before you make any decision. (choose the best option by considering all factors) Please pay attention to the predition dates and the validity range of the predicted prices.

The final result of the 5-day RDC SEMICONDUCTOR CO (3228.TWO) predictions demonstrate that:

This prediction will be valid by Apr 30, 2024 if the real price is between 369.5297310268878732131270226091146 and 282.6786069768667175594600848853588

There will be a downward trend and -6.41% loss. Moreover, the price will be around 297.5564283967017900067730806767941. So, it is suggested that sell it.

Useful Tips: To make the most informed decisions about investing in RDC SEMICONDUCTOR CO (3228.TWO), we highly recommend visiting the 'MagicalAnalysis' and 'MgicalPrediction' websites. They also provide signals for free. 'MagicalAnalysis' provides signals based on technical analysis and various strategies for free. 'MgicalPrediction' provides signals based on various AI models for free.

Forecast charts of the RDC SEMICONDUCTOR CO (3228.TWO) stock prices in the next 5 days

Price trend prediction of RDC SEMICONDUCTOR CO (3228.TWO) stock for the next 5 days

Moderate Downtrend -51.22%

RDC SEMICONDUCTOR CO (3228.TWO) stock profit and loss prediction for the next 5 days

Strong Loss -6.41%

Forecast chart of the highest and lowest RDC SEMICONDUCTOR CO (3228.TWO) stock prices in the next 5 days

RDC SEMICONDUCTOR CO (3228.TWO) stock price prediction for the next 10 days on 25 Apr 2024

10-Day prediction shows that the price will grow by 0% probability and have a downward trend by 14.47% probability. Moreover, the probability that RDC SEMICONDUCTOR CO (3228.TWO) price has no a definite trend is 85.53% (The price fluctuation will be experienced). So, RDC SEMICONDUCTOR CO (3228.TWO) price is expected to be neutral in the next 10 days. In the 10-day price prediction, RDC SEMICONDUCTOR CO (3228.TWO) price will reach 354.9983042478561401367187500000000 and 294.1501023769378662109375000000000 in the best and worst conditions respectively.

Note! All of the predictions are based on daily price changes and none of other external effects such as news, companies’ situations, and different events are not taken into account. So, you really need to consider all factors before you make any decision. (choose the best option by considering all factors) Please pay attention to the predition dates and the validity range of the predicted prices.

The final result of the 10-day RDC SEMICONDUCTOR CO (3228.TWO) predictions demonstrate that:

This prediction will be valid by May 05, 2024 if the real price is between 372.7482194602489471435546875000000 and 279.4425972580909842690743971616030

There wil be a neutral trend and meanwhile -6.51% loss. Moreover, the price will be around 294.1501023769378662109375000000000. So, it is suggested that sell it more carefully.

Useful Tips: To make the most informed decisions about investing in RDC SEMICONDUCTOR CO (3228.TWO), we highly recommend visiting the 'MagicalAnalysis' and 'MgicalPrediction' websites. They also provide signals for free. 'MagicalAnalysis' provides signals based on technical analysis and various strategies for free. 'MgicalPrediction' provides signals based on various AI models for free.

Forecast charts of the RDC SEMICONDUCTOR CO (3228.TWO) stock prices in the next 10 days

Price trend prediction of RDC SEMICONDUCTOR CO (3228.TWO) stock for the next 10 days

Neutral -14.47%

RDC SEMICONDUCTOR CO (3228.TWO) stock profit and loss prediction for the next 10 days

Moderate Loss -6.51%

Forecast chart of the highest and lowest RDC SEMICONDUCTOR CO (3228.TWO) stock prices in the next 10 days

RDC SEMICONDUCTOR CO (3228.TWO) stock price prediction for the next 30 days on 25 Apr 2024

30-Day prediction shows that the price will grow by 0% probability and have a downward trend by 7.79% probability. Moreover, the probability that RDC SEMICONDUCTOR CO (3228.TWO) price has no a definite trend is 92.21% (The price fluctuation will be experienced). So, RDC SEMICONDUCTOR CO (3228.TWO) price is expected to be neutral in the next 30 days. In the 30-day price prediction, RDC SEMICONDUCTOR CO (3228.TWO) price will reach 367.4986449360847586831368971616030 and 221.4348679333925247192382812500000 in the best and worst conditions respectively.

Note! All of the predictions are based on daily price changes and none of other external effects such as news, companies’ situations, and different events are not taken into account. So, you really need to consider all factors before you make any decision. (choose the best option by considering all factors) Please pay attention to the predition dates and the validity range of the predicted prices.

The final result of the 30-day RDC SEMICONDUCTOR CO (3228.TWO) predictions demonstrate that:

This prediction will be valid by May 25, 2024 if the real price is between 385.8735771828889937751227989792824 and 210.3631245367228927989344811066985

There wil be a neutral trend and meanwhile -10.09% loss. Moreover, the price will be around 269.6602475196123123168945312500000. So, it is suggested that sell it more carefully.

Useful Tips: To make the most informed decisions about investing in RDC SEMICONDUCTOR CO (3228.TWO), we highly recommend visiting the 'MagicalAnalysis' and 'MgicalPrediction' websites. They also provide signals for free. 'MagicalAnalysis' provides signals based on technical analysis and various strategies for free. 'MgicalPrediction' provides signals based on various AI models for free.

Forecast charts of the RDC SEMICONDUCTOR CO (3228.TWO) stock prices in the next 30 days

Price trend prediction of RDC SEMICONDUCTOR CO (3228.TWO) stock for the next 30 days

Neutral -7.79%

RDC SEMICONDUCTOR CO (3228.TWO) stock profit and loss prediction for the next 30 days

Moderate Loss -10.09%

Forecast chart of the highest and lowest RDC SEMICONDUCTOR CO (3228.TWO) stock prices in the next 30 days

Users forecasts for RDC SEMICONDUCTOR CO (3228.TWO)

What is your prediction?

In this section, you can easily predict without user registration. See also other users predictions.

RDC SEMICONDUCTOR CO (3228.TWO) predictions by visitors

RDC SEMICONDUCTOR CO (3228.TWO) predictions by visitors

Please enter your name correctly.
Please enter your email correctly
Please enter your text.