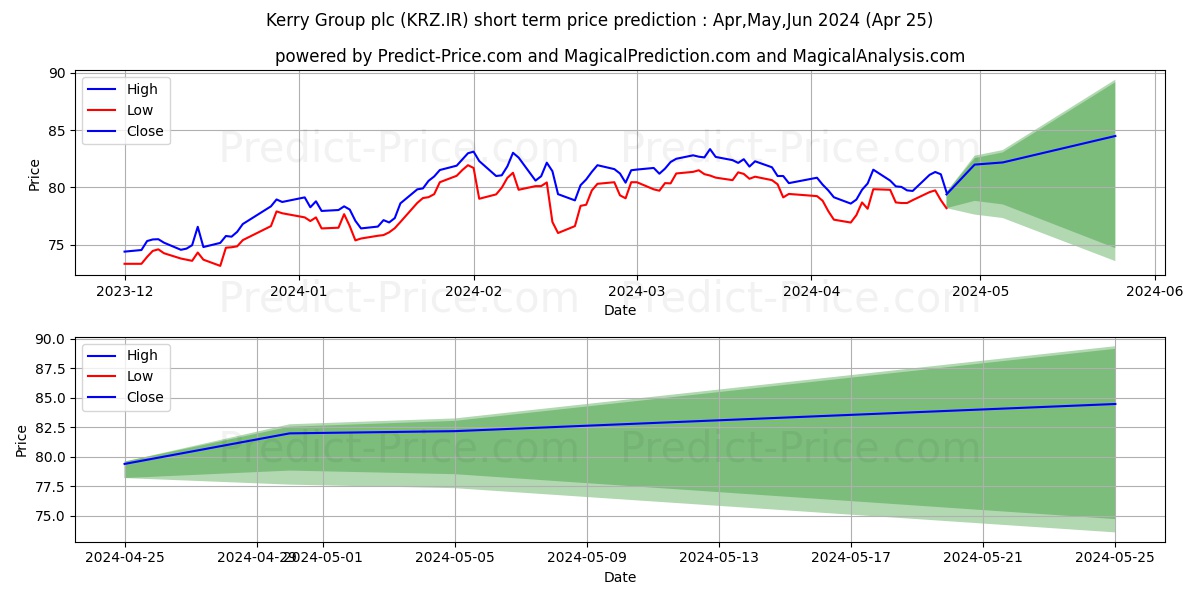
Maximum and minimum KERRY GROUP PLC short-term price forecast for May,Jun,Jul 2024

KERRY GROUP PLC stock short term price prediction: May,Jun,Jul 2024|KRZ.IR: 102.4168395406137221925746416673064
Period Action Trend Status Action & Trend & Status Ceiling price Floor price Ceiling & Floor
5 Days Neutral Downtrend -15.54% Neutral 3.26% Neutral

Downtrend:-15.54%

Neutral:3.26%
82.7645200313487237053777789697051 77.6440551247592338768299669027328 82.7645200313487237053777789697051
77.6440551247592338768299669027328
10 Days Neutral Downtrend -18.09% Neutral 3.5% Neutral

Downtrend:-18.09%

Neutral:3.5%
83.2592264427639747736975550651550 77.3426802159137878334149718284607 83.2592264427639747736975550651550
77.3426802159137878334149718284607
30 Days Neutral Neutral -9.34% Neutral 6.4% Neutral

Neutral:-9.34%

Neutral:6.4%
89.3843496735855325141528737731278 73.5930617103758777375333011150360 89.3843496735855325141528737731278
73.5930617103758777375333011150360

KERRY GROUP PLC (KRZ.IR) stock price prediction for the next 5 days on 25 Apr 2024

5-Day prediction shows that the price will grow by 0% probability and have a downward trend by 15.54% probability. Moreover, the probability that KERRY GROUP PLC (KRZ.IR) price has no a definite trend is 84.46% (The price fluctuation will be experienced). So, KERRY GROUP PLC (KRZ.IR) price is expected to be neutral in the next 5 days. In the 5-day price prediction, KERRY GROUP PLC (KRZ.IR) price will reach 82.5565721450886513821387779898942 and 78.8355285929443709846964338794351 in the best and worst conditions respectively.

Note! All of the predictions are based on daily price changes and none of other external effects such as news, companies’ situations, and different events are not taken into account. So, you really need to consider all factors before you make any decision. (choose the best option by considering all factors) Please pay attention to the predition dates and the validity range of the predicted prices.

The final result of the 5-day KERRY GROUP PLC (KRZ.IR) predictions demonstrate that:

This prediction will be valid by Apr 30, 2024 if the real price is between 86.6844007523430803985320380888879 and 74.8937521632971510143761406652629

There will be a neutral trend and meanwhile 3.26% profit. Moreover, the price will be around 82.5565721450886513821387779898942. So, it is suggested that take a look at the next days predictions because of the high risk of the trade.

Useful Tips: To make the most informed decisions about investing in KERRY GROUP PLC (KRZ.IR), we highly recommend visiting the 'MagicalAnalysis' and 'MgicalPrediction' websites. They also provide signals for free. 'MagicalAnalysis' provides signals based on technical analysis and various strategies for free. 'MgicalPrediction' provides signals based on various AI models for free.

Forecast charts of the KERRY GROUP PLC (KRZ.IR) stock prices in the next 5 days

Price trend prediction of KERRY GROUP PLC (KRZ.IR) stock for the next 5 days

Neutral -15.54%

KERRY GROUP PLC (KRZ.IR) stock profit and loss prediction for the next 5 days

Moderate Profit 3.26%

Forecast chart of the highest and lowest KERRY GROUP PLC (KRZ.IR) stock prices in the next 5 days

KERRY GROUP PLC (KRZ.IR) stock price prediction for the next 10 days on 25 Apr 2024

10-Day prediction shows that the price will grow by 0% probability and have a downward trend by 18.09% probability. Moreover, the probability that KERRY GROUP PLC (KRZ.IR) price has no a definite trend is 81.91% (The price fluctuation will be experienced). So, KERRY GROUP PLC (KRZ.IR) price is expected to be neutral in the next 10 days. In the 10-day price prediction, KERRY GROUP PLC (KRZ.IR) price will reach 83.0500355945132469059899449348450 and 78.5295289873685788961665821261704 in the best and worst conditions respectively.

Note! All of the predictions are based on daily price changes and none of other external effects such as news, companies’ situations, and different events are not taken into account. So, you really need to consider all factors before you make any decision. (choose the best option by considering all factors) Please pay attention to the predition dates and the validity range of the predicted prices.

The final result of the 10-day KERRY GROUP PLC (KRZ.IR) predictions demonstrate that:

This prediction will be valid by May 05, 2024 if the real price is between 87.2025373742389149356313282623887 and 74.6030525380001563462428748607635

There will be a neutral trend and meanwhile 3.5% profit. Moreover, the price will be around 83.0500355945132469059899449348450. So, it is suggested that take a look at the next days predictions because of the high risk of the trade.

Useful Tips: To make the most informed decisions about investing in KERRY GROUP PLC (KRZ.IR), we highly recommend visiting the 'MagicalAnalysis' and 'MgicalPrediction' websites. They also provide signals for free. 'MagicalAnalysis' provides signals based on technical analysis and various strategies for free. 'MgicalPrediction' provides signals based on various AI models for free.

Forecast charts of the KERRY GROUP PLC (KRZ.IR) stock prices in the next 10 days

Price trend prediction of KERRY GROUP PLC (KRZ.IR) stock for the next 10 days

Neutral -18.09%

KERRY GROUP PLC (KRZ.IR) stock profit and loss prediction for the next 10 days

Neutral 3.5%

Forecast chart of the highest and lowest KERRY GROUP PLC (KRZ.IR) stock prices in the next 10 days

KERRY GROUP PLC (KRZ.IR) stock price prediction for the next 30 days on 25 Apr 2024

30-Day prediction shows that the price will grow by 0% probability and have a downward trend by 9.34% probability. Moreover, the probability that KERRY GROUP PLC (KRZ.IR) price has no a definite trend is 90.66% (The price fluctuation will be experienced). So, KERRY GROUP PLC (KRZ.IR) price is expected to be neutral in the next 30 days. In the 30-day price prediction, KERRY GROUP PLC (KRZ.IR) price will reach 89.1597693030074935904849553480744 and 73.5930617103758777375333011150360 in the best and worst conditions respectively.

Note! All of the predictions are based on daily price changes and none of other external effects such as news, companies’ situations, and different events are not taken into account. So, you really need to consider all factors before you make any decision. (choose the best option by considering all factors) Please pay attention to the predition dates and the validity range of the predicted prices.

The final result of the 30-day KERRY GROUP PLC (KRZ.IR) predictions demonstrate that:

This prediction will be valid by May 25, 2024 if the real price is between 93.6177577681578725332656176760793 and 69.9134086248570838506566360592842

There will be a neutral trend and meanwhile 6.4% profit. Moreover, the price will be around 89.1597693030074935904849553480744. So, it is suggested that take a look at the next days predictions because of the high risk of the trade.

Useful Tips: To make the most informed decisions about investing in KERRY GROUP PLC (KRZ.IR), we highly recommend visiting the 'MagicalAnalysis' and 'MgicalPrediction' websites. They also provide signals for free. 'MagicalAnalysis' provides signals based on technical analysis and various strategies for free. 'MgicalPrediction' provides signals based on various AI models for free.

Forecast charts of the KERRY GROUP PLC (KRZ.IR) stock prices in the next 30 days

Price trend prediction of KERRY GROUP PLC (KRZ.IR) stock for the next 30 days

Neutral -9.34%

KERRY GROUP PLC (KRZ.IR) stock profit and loss prediction for the next 30 days

Neutral 6.4%

Forecast chart of the highest and lowest KERRY GROUP PLC (KRZ.IR) stock prices in the next 30 days

Users forecasts for KERRY GROUP PLC (KRZ.IR)

What is your prediction?

In this section, you can easily predict without user registration. See also other users predictions.

KERRY GROUP PLC (KRZ.IR) predictions by visitors

KERRY GROUP PLC (KRZ.IR) predictions by visitors

Please enter your name correctly.
Please enter your email correctly
Please enter your text.