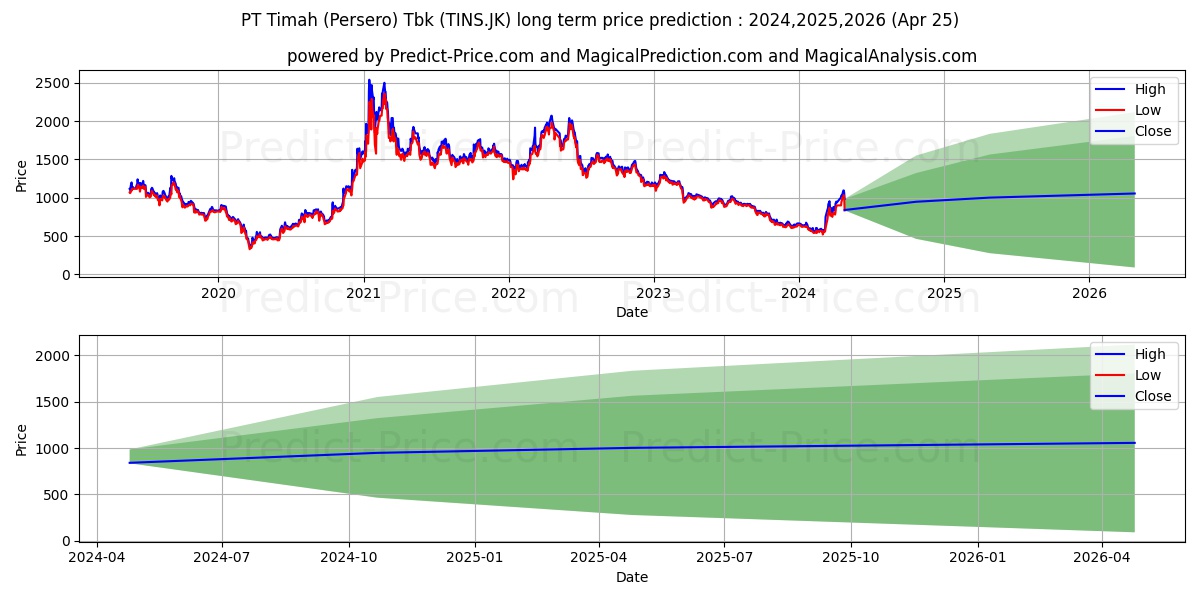
Maximum and minimum Timah Tbk. long-term price forecast for 2024,2025,2026

Timah Tbk. stock long term price prediction: 2024,2025,2026|TINS.JK: 905.3336
Period Action Trend Status Action & Trend & Status Ceiling price Floor price Ceiling & Floor
6 Months Neutral Neutral -12.11% Profit 12.83% Neutral

Neutral:-12.11%

Profit:12.83%
905.3336274623870849609375000000000 310.1050281524658203125000000000000 905.3336274623870849609375000000000
310.1050281524658203125000000000000
1 Year Neutral Downtrend -27.52% Profit 19.24% Neutral

Downtrend:-27.52%

Profit:19.24%
1,070.5004411935806274414062500000000 185.1575422286987304687500000000000 1,070.5004411935806274414062500000000
185.1575422286987304687500000000000
2 Years Neutral Downtrend -22.02% Profit 25.65% Neutral

Downtrend:-22.02%

Profit:25.65%
1,235.6672549247741699218750000000000 60.2100563049316406250000000000000 1,235.6672549247741699218750000000000
60.2100563049316406250000000000000

Timah Tbk. (TINS.JK) stock price prediction until 25 Oct 2024 (update date: 25 Apr 2024)

Forecast until 25 Oct 2024 shows that the price will grow by 0% probability and have a downward trend by 12.11% probability. Moreover, the probability that Timah Tbk. (TINS.JK) price has no a definite trend is 87.89% (The price fluctuation will be experienced). So, Timah Tbk. (TINS.JK) price is expected to be neutral in the next 6 Months. In the forecast until 25 Oct 2024, Timah Tbk. (TINS.JK) price will reach 897.4611611366271972656250000000000 and 315.6426179409027099609375000000000 in the best and worst conditions respectively.

Note! All of the predictions are based on daily price changes and none of other external effects such as news, companies’ situations, and different events are not taken into account. So, you really need to consider all factors before you make any decision. (choose the best option by considering all factors) Please pay attention to the predition dates and the validity range of the predicted prices.

The final result of the predictions until 25 Oct 2024 for Timah Tbk. (TINS.JK) shows that:

This prediction will be valid by 25 Oct 2024 if the real price is between 942.3342191934585798662737943232059 and 299.8604870438575744628906250000000

There will be a neutral trend and meanwhile 12.83% profit. Moreover, the price will be around . So, it is suggested that buy it more carefully.

Useful Tips: To make the most informed decisions about investing in Timah Tbk. (TINS.JK), we highly recommend visiting the 'MagicalAnalysis' and 'MgicalPrediction' websites. They also provide signals for free. 'MagicalAnalysis' provides signals based on technical analysis and various strategies for free. 'MgicalPrediction' provides signals based on various AI models for free.

Timah Tbk. (TINS.JK) stock price forecast charts until 25 Oct 2024

Timah Tbk. (TINS.JK) stock profit and loss prediction until 25 Oct 2024

Neutral -12.11%

Timah Tbk. (TINS.JK) stock profit and loss prediction for the next 25 days

Strong Profit 12.83%

The prediction chart of the highest and lowest price of Timah Tbk. (TINS.JK) stock until 25 Oct 2024 Forecast chart of the highest and lowest 25 Apr 2024

Timah Tbk. (TINS.JK) stock price prediction until 25 Apr 2025 (update date: 25 Apr 2024)

Forecast until 25 Apr 2025 shows that the price will grow by 0% probability and have a downward trend by 27.52% probability. Moreover, the probability that Timah Tbk. (TINS.JK) price has no a definite trend is 72.48% (The price fluctuation will be experienced). So, Timah Tbk. (TINS.JK) price is expected to be neutral in the next 12 Months. In the forecast until 25 Apr 2025, Timah Tbk. (TINS.JK) price will reach 1,061.1917417049407958984375000000000 and 188.4639269113540649414062500000000 in the best and worst conditions respectively.

Note! All of the predictions are based on daily price changes and none of other external effects such as news, companies’ situations, and different events are not taken into account. So, you really need to consider all factors before you make any decision. (choose the best option by considering all factors) Please pay attention to the predition dates and the validity range of the predicted prices.

The final result of the predictions until 25 Apr 2025 for Timah Tbk. (TINS.JK) shows that:

This prediction will be valid by 25 Apr 2025 if the real price is between 1,114.2513287901879266428295522928238 and -9.4231963455677032470703125000000

There will be a neutral trend and meanwhile 19.24% profit. Moreover, the price will be around 1,061.1917417049407958984375000000000. So, it is suggested that buy it more carefully.

Useful Tips: To make the most informed decisions about investing in Timah Tbk. (TINS.JK), we highly recommend visiting the 'MagicalAnalysis' and 'MgicalPrediction' websites. They also provide signals for free. 'MagicalAnalysis' provides signals based on technical analysis and various strategies for free. 'MgicalPrediction' provides signals based on various AI models for free.

Timah Tbk. (TINS.JK) stock price forecast charts until 25 Apr 2025

Timah Tbk. (TINS.JK) stock profit and loss prediction until 25 Apr 2025

Neutral -27.52%

Timah Tbk. (TINS.JK) stock profit and loss prediction for the next 25 days

Moderate Profit 19.24%

The prediction chart of the highest and lowest price of Timah Tbk. (TINS.JK) stock until 25 Apr 2025 Forecast chart of the highest and lowest 25 Apr 2024

Timah Tbk. (TINS.JK) stock price prediction until 25 Apr 2026 (update date: 25 Apr 2024)

Forecast until 25 Apr 2026 shows that the price will grow by 0% probability and have a downward trend by 22.02% probability. Moreover, the probability that Timah Tbk. (TINS.JK) price has no a definite trend is 77.98% (The price fluctuation will be experienced). So, Timah Tbk. (TINS.JK) price is expected to be neutral in the next 24 Months. In the forecast until 25 Apr 2026, Timah Tbk. (TINS.JK) price will reach 1,224.9223222732543945312500000000000 and 60.2100563049316406250000000000000 in the best and worst conditions respectively.

Note! All of the predictions are based on daily price changes and none of other external effects such as news, companies’ situations, and different events are not taken into account. So, you really need to consider all factors before you make any decision. (choose the best option by considering all factors) Please pay attention to the predition dates and the validity range of the predicted prices.

The final result of the predictions until 25 Apr 2026 for Timah Tbk. (TINS.JK) shows that:

This prediction will be valid by 25 Apr 2026 if the real price is between 1,286.1684383869171597325475886464119 and 57.1995534896850585937500000000000

There will be a neutral trend and meanwhile 25.65% profit. Moreover, the price will be around 1,224.9223222732543945312500000000000. So, it is suggested that buy it more carefully.

Useful Tips: To make the most informed decisions about investing in Timah Tbk. (TINS.JK), we highly recommend visiting the 'MagicalAnalysis' and 'MgicalPrediction' websites. They also provide signals for free. 'MagicalAnalysis' provides signals based on technical analysis and various strategies for free. 'MgicalPrediction' provides signals based on various AI models for free.

Timah Tbk. (TINS.JK) stock price forecast charts until 25 Apr 2026

Timah Tbk. (TINS.JK) stock profit and loss prediction until 25 Apr 2026

Neutral -22.02%

Timah Tbk. (TINS.JK) stock profit and loss prediction for the next 25 days

Strong Profit 25.65%

The prediction chart of the highest and lowest price of Timah Tbk. (TINS.JK) stock until 25 Apr 2026 Forecast chart of the highest and lowest 25 Apr 2024

Users forecasts for Timah Tbk. (TINS.JK)

What is your prediction?

In this section, you can easily predict without user registration. See also other users predictions.

Timah Tbk. (TINS.JK) predictions by visitors

Timah Tbk. (TINS.JK) predictions by visitors

Please enter your name correctly.
Please enter your email correctly
Please enter your text.