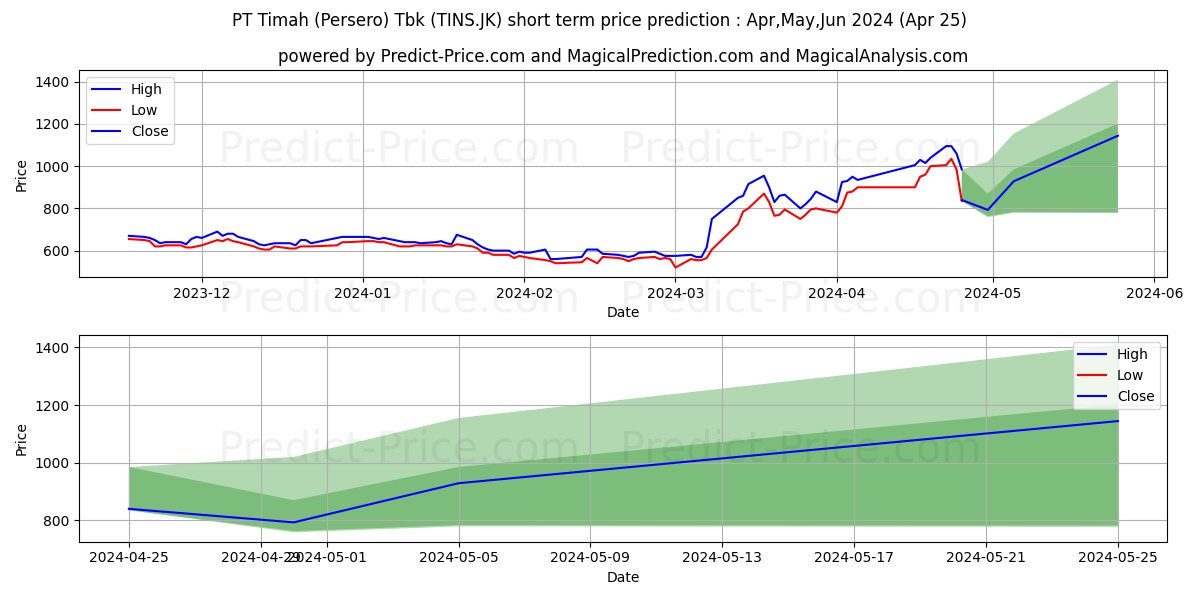
Maximum and minimum Timah Tbk. short-term price forecast for May,Jun,Jul 2024

Timah Tbk. stock short term price prediction: May,Jun,Jul 2024|TINS.JK: 905.3336274623870849609375000000000
Period Action Trend Status Action & Trend & Status Ceiling price Floor price Ceiling & Floor
5 Days Sell Downtrend -23.9% Loss -5.6% Sell

Downtrend:-23.9%

Loss:-5.6%
1,020.1837916374206542968750000000000 758.4357809424400329589843750000000 1,020.1837916374206542968750000000000
758.4357809424400329589843750000000
10 Days Neutral Neutral 13.73% Profit 10.57% Neutral

Neutral:13.73%

Profit:10.57%
1,155.1040866971015930175781250000000 779.0184028148651123046875000000000 1,155.1040866971015930175781250000000
779.0184028148651123046875000000000
30 Days Neutral Neutral -5.33% Profit 36.22% Neutral

Neutral:-5.33%

Profit:36.22%
1,409.7210834026336669921875000000000 777.4133391678333282470703125000000 1,409.7210834026336669921875000000000
777.4133391678333282470703125000000

Timah Tbk. (TINS.JK) stock price prediction for the next 5 days on 25 Apr 2024

5-Day prediction shows that the price will grow by 0% probability and have a downward trend by 23.9% probability. Moreover, the probability that Timah Tbk. (TINS.JK) price has no a definite trend is 76.1% (The price fluctuation will be experienced). So, Timah Tbk. (TINS.JK) price is expected to be neutral in the next 5 days. In the 5-day price prediction, Timah Tbk. (TINS.JK) price will reach 870.0044517517089843750000000000000 and 762.9773125648498535156250000000000 in the best and worst conditions respectively.

Note! All of the predictions are based on daily price changes and none of other external effects such as news, companies’ situations, and different events are not taken into account. So, you really need to consider all factors before you make any decision. (choose the best option by considering all factors) Please pay attention to the predition dates and the validity range of the predicted prices.

The final result of the 5-day Timah Tbk. (TINS.JK) predictions demonstrate that:

This prediction will be valid by Apr 30, 2024 if the real price is between 913.5046743392944108563824556767941 and 724.8284469366074063145788386464119

There wil be a neutral trend and meanwhile -5.6% loss. Moreover, the price will be around 762.9773125648498535156250000000000. So, it is suggested that sell it more carefully.

Useful Tips: To make the most informed decisions about investing in Timah Tbk. (TINS.JK), we highly recommend visiting the 'MagicalAnalysis' and 'MgicalPrediction' websites. They also provide signals for free. 'MagicalAnalysis' provides signals based on technical analysis and various strategies for free. 'MgicalPrediction' provides signals based on various AI models for free.

Forecast charts of the Timah Tbk. (TINS.JK) stock prices in the next 5 days

Price trend prediction of Timah Tbk. (TINS.JK) stock for the next 5 days

Neutral -23.9%

Timah Tbk. (TINS.JK) stock profit and loss prediction for the next 5 days

Strong Loss -5.6%

Forecast chart of the highest and lowest Timah Tbk. (TINS.JK) stock prices in the next 5 days

Timah Tbk. (TINS.JK) stock price prediction for the next 10 days on 25 Apr 2024

10-Day prediction shows that the price will grow by 13.73% probability and have a downward trend by 0% probability. Moreover, the probability that Timah Tbk. (TINS.JK) price has no a definite trend is 86.27% (The price fluctuation will be experienced). So, Timah Tbk. (TINS.JK) price is expected to be neutral in the next 10 days. In the 10-day price prediction, Timah Tbk. (TINS.JK) price will reach 985.0633835792541503906250000000000 and 783.6831836700439453125000000000000 in the best and worst conditions respectively.

Note! All of the predictions are based on daily price changes and none of other external effects such as news, companies’ situations, and different events are not taken into account. So, you really need to consider all factors before you make any decision. (choose the best option by considering all factors) Please pay attention to the predition dates and the validity range of the predicted prices.

The final result of the 10-day Timah Tbk. (TINS.JK) predictions demonstrate that:

This prediction will be valid by May 05, 2024 if the real price is between 1,034.3165527582168579101562500000000 and 744.4990244865417707842425443232059

There will be a neutral trend and meanwhile 10.57% profit. Moreover, the price will be around 985.0633835792541503906250000000000. So, it is suggested that buy it more carefully.

Useful Tips: To make the most informed decisions about investing in Timah Tbk. (TINS.JK), we highly recommend visiting the 'MagicalAnalysis' and 'MgicalPrediction' websites. They also provide signals for free. 'MagicalAnalysis' provides signals based on technical analysis and various strategies for free. 'MgicalPrediction' provides signals based on various AI models for free.

Forecast charts of the Timah Tbk. (TINS.JK) stock prices in the next 10 days

Price trend prediction of Timah Tbk. (TINS.JK) stock for the next 10 days

Neutral 13.73%

Timah Tbk. (TINS.JK) stock profit and loss prediction for the next 10 days

Moderate Profit 10.57%

Forecast chart of the highest and lowest Timah Tbk. (TINS.JK) stock prices in the next 10 days

Timah Tbk. (TINS.JK) stock price prediction for the next 30 days on 25 Apr 2024

30-Day prediction shows that the price will grow by 0% probability and have a downward trend by 5.33% probability. Moreover, the probability that Timah Tbk. (TINS.JK) price has no a definite trend is 94.67% (The price fluctuation will be experienced). So, Timah Tbk. (TINS.JK) price is expected to be neutral in the next 30 days. In the 30-day price prediction, Timah Tbk. (TINS.JK) price will reach 1,202.1986904144287109375000000000000 and 777.4133391678333282470703125000000 in the best and worst conditions respectively.

Note! All of the predictions are based on daily price changes and none of other external effects such as news, companies’ situations, and different events are not taken into account. So, you really need to consider all factors before you make any decision. (choose the best option by considering all factors) Please pay attention to the predition dates and the validity range of the predicted prices.

The final result of the 30-day Timah Tbk. (TINS.JK) predictions demonstrate that:

This prediction will be valid by May 25, 2024 if the real price is between 1,262.3086249351501919591100886464119 and 738.5426722094416618347167968750000

There will be a neutral trend and meanwhile 36.22% profit. Moreover, the price will be around 1,202.1986904144287109375000000000000. So, it is suggested that buy it more carefully.

Useful Tips: To make the most informed decisions about investing in Timah Tbk. (TINS.JK), we highly recommend visiting the 'MagicalAnalysis' and 'MgicalPrediction' websites. They also provide signals for free. 'MagicalAnalysis' provides signals based on technical analysis and various strategies for free. 'MgicalPrediction' provides signals based on various AI models for free.

Forecast charts of the Timah Tbk. (TINS.JK) stock prices in the next 30 days

Price trend prediction of Timah Tbk. (TINS.JK) stock for the next 30 days

Neutral -5.33%

Timah Tbk. (TINS.JK) stock profit and loss prediction for the next 30 days

Strong Profit 36.22%

Forecast chart of the highest and lowest Timah Tbk. (TINS.JK) stock prices in the next 30 days

Users forecasts for Timah Tbk. (TINS.JK)

What is your prediction?

In this section, you can easily predict without user registration. See also other users predictions.

Timah Tbk. (TINS.JK) predictions by visitors

Timah Tbk. (TINS.JK) predictions by visitors

Please enter your name correctly.
Please enter your email correctly
Please enter your text.