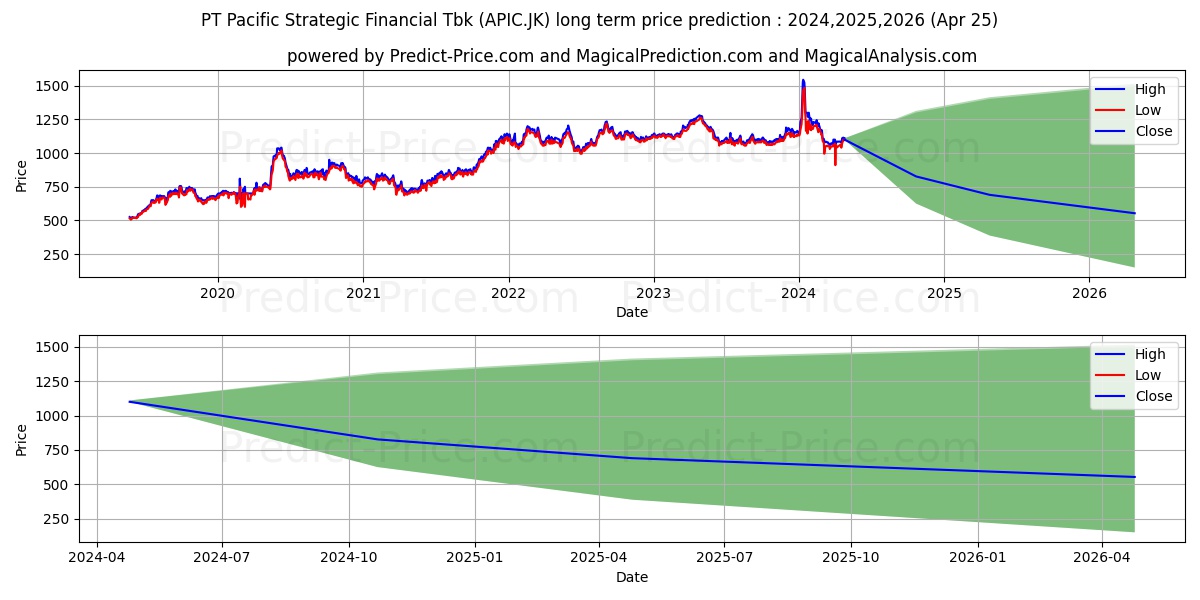
Maximum and minimum Pacific Strategic Financial Tbk long-term price forecast for 2024,2025,2026

Pacific Strategic Financial Tbk stock long term price prediction: 2024,2025,2026|APIC.JK: 1354.8102
Period Action Trend Status Action & Trend & Status Ceiling price Floor price Ceiling & Floor
6 Months Neutral Neutral -13.89% Loss -24.87% Neutral

Neutral:-13.89%

Loss:-24.87%
1,354.8102190494537353515625000000000 630.5525994300842285156250000000000 1,354.8102190494537353515625000000000
630.5525994300842285156250000000000
1 Year Neutral Neutral 6.31% Loss -37.3% Neutral

Neutral:6.31%

Loss:-37.3%
1,459.7153285741806030273437500000000 390.8288991451263427734375000000000 1,459.7153285741806030273437500000000
390.8288991451263427734375000000000
2 Years Neutral Uptrend 16.18% Loss -49.74% Neutral

Uptrend:16.18%

Loss:-49.74%
1,564.6204380989074707031250000000000 151.1051988601684570312500000000000 1,564.6204380989074707031250000000000
151.1051988601684570312500000000000

Pacific Strategic Financial Tbk (APIC.JK) stock price prediction until 25 Oct 2024 (update date: 25 Apr 2024)

Forecast until 25 Oct 2024 shows that the price will grow by 0% probability and have a downward trend by 13.89% probability. Moreover, the probability that Pacific Strategic Financial Tbk (APIC.JK) price has no a definite trend is 86.11% (The price fluctuation will be experienced). So, Pacific Strategic Financial Tbk (APIC.JK) price is expected to be neutral in the next 6 Months. In the forecast until 25 Oct 2024, Pacific Strategic Financial Tbk (APIC.JK) price will reach 1,313.3968062400817871093750000000000 and 630.5525994300842285156250000000000 in the best and worst conditions respectively.

Note! All of the predictions are based on daily price changes and none of other external effects such as news, companies’ situations, and different events are not taken into account. So, you really need to consider all factors before you make any decision. (choose the best option by considering all factors) Please pay attention to the predition dates and the validity range of the predicted prices.

The final result of the predictions until 25 Oct 2024 for Pacific Strategic Financial Tbk (APIC.JK) shows that:

This prediction will be valid by 25 Oct 2024 if the real price is between 1,379.0666465520857855153735727071762 and 599.0249694585800170898437500000000

There wil be a neutral trend and meanwhile -24.87% loss. Moreover, the price will be around . So, it is suggested that sell it more carefully.

Useful Tips: To make the most informed decisions about investing in Pacific Strategic Financial Tbk (APIC.JK), we highly recommend visiting the 'MagicalAnalysis' and 'MgicalPrediction' websites. They also provide signals for free. 'MagicalAnalysis' provides signals based on technical analysis and various strategies for free. 'MgicalPrediction' provides signals based on various AI models for free.

Pacific Strategic Financial Tbk (APIC.JK) stock price forecast charts until 25 Oct 2024

Pacific Strategic Financial Tbk (APIC.JK) stock profit and loss prediction until 25 Oct 2024

Neutral -13.89%

Pacific Strategic Financial Tbk (APIC.JK) stock profit and loss prediction for the next 25 days

Strong Loss -24.87%

The prediction chart of the highest and lowest price of Pacific Strategic Financial Tbk (APIC.JK) stock until 25 Oct 2024 Forecast chart of the highest and lowest 25 Apr 2024

Pacific Strategic Financial Tbk (APIC.JK) stock price prediction until 25 Apr 2025 (update date: 25 Apr 2024)

Forecast until 25 Apr 2025 shows that the price will grow by 6.31% probability and have a downward trend by 0% probability. Moreover, the probability that Pacific Strategic Financial Tbk (APIC.JK) price has no a definite trend is 93.69% (The price fluctuation will be experienced). So, Pacific Strategic Financial Tbk (APIC.JK) price is expected to be neutral in the next 12 Months. In the forecast until 25 Apr 2025, Pacific Strategic Financial Tbk (APIC.JK) price will reach 1,415.0952093601226806640625000000000 and 390.8288991451263427734375000000000 in the best and worst conditions respectively.

Note! All of the predictions are based on daily price changes and none of other external effects such as news, companies’ situations, and different events are not taken into account. So, you really need to consider all factors before you make any decision. (choose the best option by considering all factors) Please pay attention to the predition dates and the validity range of the predicted prices.

The final result of the predictions until 25 Apr 2025 for Pacific Strategic Financial Tbk (APIC.JK) shows that:

This prediction will be valid by 25 Apr 2025 if the real price is between 1,485.8499698281289056467358022928238 and -19.5414449572563171386718750000000

There wil be a neutral trend and meanwhile -37.3% loss. Moreover, the price will be around 390.8288991451263427734375000000000. So, it is suggested that sell it more carefully.

Useful Tips: To make the most informed decisions about investing in Pacific Strategic Financial Tbk (APIC.JK), we highly recommend visiting the 'MagicalAnalysis' and 'MgicalPrediction' websites. They also provide signals for free. 'MagicalAnalysis' provides signals based on technical analysis and various strategies for free. 'MgicalPrediction' provides signals based on various AI models for free.

Pacific Strategic Financial Tbk (APIC.JK) stock price forecast charts until 25 Apr 2025

Pacific Strategic Financial Tbk (APIC.JK) stock profit and loss prediction until 25 Apr 2025

Neutral 6.31%

Pacific Strategic Financial Tbk (APIC.JK) stock profit and loss prediction for the next 25 days

Strong Loss -37.3%

The prediction chart of the highest and lowest price of Pacific Strategic Financial Tbk (APIC.JK) stock until 25 Apr 2025 Forecast chart of the highest and lowest 25 Apr 2024

Pacific Strategic Financial Tbk (APIC.JK) stock price prediction until 25 Apr 2026 (update date: 25 Apr 2024)

Forecast until 25 Apr 2026 shows that the price will grow by 16.18% probability and have a downward trend by 0% probability. Moreover, the probability that Pacific Strategic Financial Tbk (APIC.JK) price has no a definite trend is 83.82% (The price fluctuation will be experienced). So, Pacific Strategic Financial Tbk (APIC.JK) price is expected to be neutral in the next 24 Months. In the forecast until 25 Apr 2026, Pacific Strategic Financial Tbk (APIC.JK) price will reach 1,516.7936124801635742187500000000000 and 151.1051988601684570312500000000000 in the best and worst conditions respectively.

Note! All of the predictions are based on daily price changes and none of other external effects such as news, companies’ situations, and different events are not taken into account. So, you really need to consider all factors before you make any decision. (choose the best option by considering all factors) Please pay attention to the predition dates and the validity range of the predicted prices.

The final result of the predictions until 25 Apr 2026 for Pacific Strategic Financial Tbk (APIC.JK) shows that:

This prediction will be valid by 25 Apr 2026 if the real price is between 1,592.6332931041717984044225886464119 and 143.5499389171600341796875000000000

There wil be a neutral trend and meanwhile -49.74% loss. Moreover, the price will be around 151.1051988601684570312500000000000. So, it is suggested that sell it more carefully.

Useful Tips: To make the most informed decisions about investing in Pacific Strategic Financial Tbk (APIC.JK), we highly recommend visiting the 'MagicalAnalysis' and 'MgicalPrediction' websites. They also provide signals for free. 'MagicalAnalysis' provides signals based on technical analysis and various strategies for free. 'MgicalPrediction' provides signals based on various AI models for free.

Pacific Strategic Financial Tbk (APIC.JK) stock price forecast charts until 25 Apr 2026

Pacific Strategic Financial Tbk (APIC.JK) stock profit and loss prediction until 25 Apr 2026

Neutral 16.18%

Pacific Strategic Financial Tbk (APIC.JK) stock profit and loss prediction for the next 25 days

Strong Loss -49.74%

The prediction chart of the highest and lowest price of Pacific Strategic Financial Tbk (APIC.JK) stock until 25 Apr 2026 Forecast chart of the highest and lowest 25 Apr 2024

Users forecasts for Pacific Strategic Financial Tbk (APIC.JK)

What is your prediction?

In this section, you can easily predict without user registration. See also other users predictions.

Pacific Strategic Financial Tbk (APIC.JK) predictions by visitors

Pacific Strategic Financial Tbk (APIC.JK) predictions by visitors

Please enter your name correctly.
Please enter your email correctly
Please enter your text.