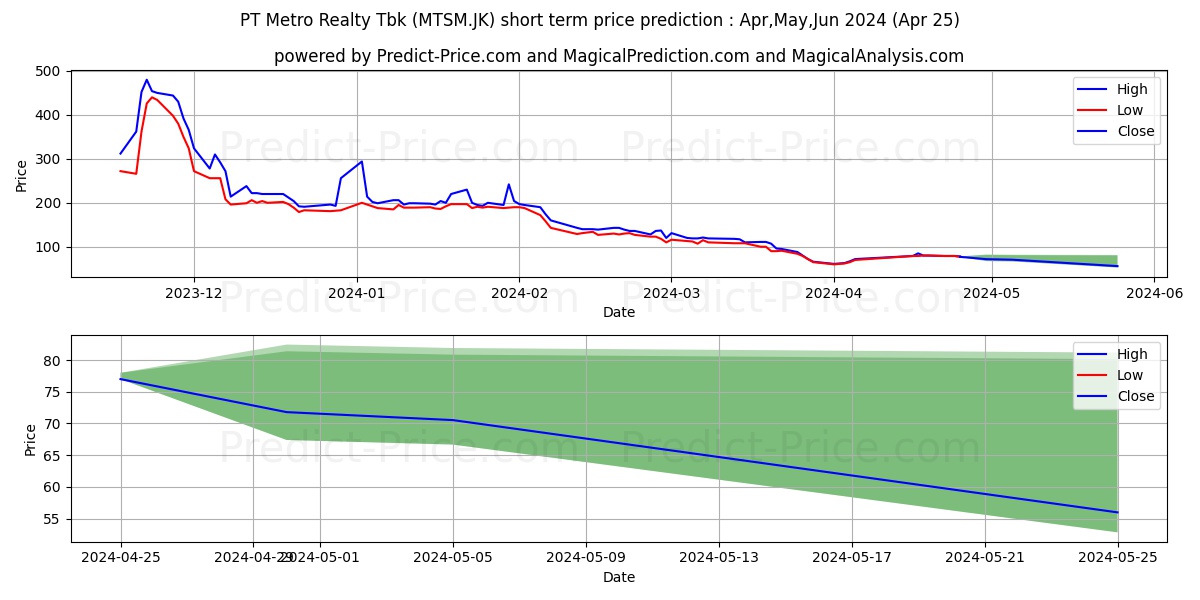
Maximum and minimum Metro Realty Tbk. short-term price forecast for May,Jun,Jul 2024

Metro Realty Tbk. stock short term price prediction: May,Jun,Jul 2024|MTSM.JK: 151.7079334259033203125000000000000
Period Action Trend Status Action & Trend & Status Ceiling price Floor price Ceiling & Floor
5 Days Neutral Uptrend 18.35% Loss -6.77% Neutral

Uptrend:18.35%

Loss:-6.77%
82.4557050704956111530918860808015 67.3917463779449406047206139191985 82.4557050704956111530918860808015
67.3917463779449406047206139191985
10 Days Sell Downtrend -23.11% Loss -8.4% Sell

Downtrend:-23.11%

Loss:-8.4%
81.9129395484924316406250000000000 66.6708755731582698444981360808015 81.9129395484924316406250000000000
66.6708755731582698444981360808015
30 Days Neutral Neutral 10.81% Loss -27.31% Neutral

Neutral:10.81%

Loss:-27.31%
81.1913467884063777546543860808015 52.8187784701585769653320312500000 81.1913467884063777546543860808015
52.8187784701585769653320312500000

Metro Realty Tbk. (MTSM.JK) stock price prediction for the next 5 days on 25 Apr 2024

5-Day prediction shows that the price will grow by 18.35% probability and have a downward trend by 0% probability. Moreover, the probability that Metro Realty Tbk. (MTSM.JK) price has no a definite trend is 81.65% (The price fluctuation will be experienced). So, Metro Realty Tbk. (MTSM.JK) price is expected to be neutral in the next 5 days. In the 5-day price prediction, Metro Realty Tbk. (MTSM.JK) price will reach 81.3985806465148868937831139191985 and 67.3917463779449406047206139191985 in the best and worst conditions respectively.

Note! All of the predictions are based on daily price changes and none of other external effects such as news, companies’ situations, and different events are not taken into account. So, you really need to consider all factors before you make any decision. (choose the best option by considering all factors) Please pay attention to the predition dates and the validity range of the predicted prices.

The final result of the 5-day Metro Realty Tbk. (MTSM.JK) predictions demonstrate that:

This prediction will be valid by Apr 30, 2024 if the real price is between 85.4685096788406326595577411353588 and 64.0221590590476949955700547434390

There wil be a neutral trend and meanwhile -6.77% loss. Moreover, the price will be around 67.3917463779449406047206139191985. So, it is suggested that sell it more carefully.

Useful Tips: To make the most informed decisions about investing in Metro Realty Tbk. (MTSM.JK), we highly recommend visiting the 'MagicalAnalysis' and 'MgicalPrediction' websites. They also provide signals for free. 'MagicalAnalysis' provides signals based on technical analysis and various strategies for free. 'MgicalPrediction' provides signals based on various AI models for free.

Forecast charts of the Metro Realty Tbk. (MTSM.JK) stock prices in the next 5 days

Price trend prediction of Metro Realty Tbk. (MTSM.JK) stock for the next 5 days

Neutral 18.35%

Metro Realty Tbk. (MTSM.JK) stock profit and loss prediction for the next 5 days

Strong Loss -6.77%

Forecast chart of the highest and lowest Metro Realty Tbk. (MTSM.JK) stock prices in the next 5 days

Metro Realty Tbk. (MTSM.JK) stock price prediction for the next 10 days on 25 Apr 2024

10-Day prediction shows that the price will grow by 0% probability and have a downward trend by 23.11% probability. Moreover, the probability that Metro Realty Tbk. (MTSM.JK) price has no a definite trend is 76.89% (The price fluctuation will be experienced). So, Metro Realty Tbk. (MTSM.JK) price is expected to be neutral in the next 10 days. In the 10-day price prediction, Metro Realty Tbk. (MTSM.JK) price will reach 80.8627736568450927734375000000000 and 66.6708755731582698444981360808015 in the best and worst conditions respectively.

Note! All of the predictions are based on daily price changes and none of other external effects such as news, companies’ situations, and different events are not taken into account. So, you really need to consider all factors before you make any decision. (choose the best option by considering all factors) Please pay attention to the predition dates and the validity range of the predicted prices.

The final result of the 10-day Metro Realty Tbk. (MTSM.JK) predictions demonstrate that:

This prediction will be valid by May 05, 2024 if the real price is between 84.9059123396873474121093750000000 and 63.3373317945003577733587007969618

There wil be a neutral trend and meanwhile -8.4% loss. Moreover, the price will be around 66.6708755731582698444981360808015. So, it is suggested that sell it more carefully.

Useful Tips: To make the most informed decisions about investing in Metro Realty Tbk. (MTSM.JK), we highly recommend visiting the 'MagicalAnalysis' and 'MgicalPrediction' websites. They also provide signals for free. 'MagicalAnalysis' provides signals based on technical analysis and various strategies for free. 'MgicalPrediction' provides signals based on various AI models for free.

Forecast charts of the Metro Realty Tbk. (MTSM.JK) stock prices in the next 10 days

Price trend prediction of Metro Realty Tbk. (MTSM.JK) stock for the next 10 days

Neutral -23.11%

Metro Realty Tbk. (MTSM.JK) stock profit and loss prediction for the next 10 days

Strong Loss -8.4%

Forecast chart of the highest and lowest Metro Realty Tbk. (MTSM.JK) stock prices in the next 10 days

Metro Realty Tbk. (MTSM.JK) stock price prediction for the next 30 days on 25 Apr 2024

30-Day prediction shows that the price will grow by 10.81% probability and have a downward trend by 0% probability. Moreover, the probability that Metro Realty Tbk. (MTSM.JK) price has no a definite trend is 89.19% (The price fluctuation will be experienced). So, Metro Realty Tbk. (MTSM.JK) price is expected to be neutral in the next 30 days. In the 30-day price prediction, Metro Realty Tbk. (MTSM.JK) price will reach 80.1504320859909000773768639191985 and 52.8187784701585769653320312500000 in the best and worst conditions respectively.

Note! All of the predictions are based on daily price changes and none of other external effects such as news, companies’ situations, and different events are not taken into account. So, you really need to consider all factors before you make any decision. (choose the best option by considering all factors) Please pay attention to the predition dates and the validity range of the predicted prices.

The final result of the 30-day Metro Realty Tbk. (MTSM.JK) predictions demonstrate that:

This prediction will be valid by May 25, 2024 if the real price is between 84.1579536902904408179892925545573 and 50.1778395466506452748944866470993

There wil be a neutral trend and meanwhile -27.31% loss. Moreover, the price will be around 52.8187784701585769653320312500000. So, it is suggested that sell it more carefully.

Useful Tips: To make the most informed decisions about investing in Metro Realty Tbk. (MTSM.JK), we highly recommend visiting the 'MagicalAnalysis' and 'MgicalPrediction' websites. They also provide signals for free. 'MagicalAnalysis' provides signals based on technical analysis and various strategies for free. 'MgicalPrediction' provides signals based on various AI models for free.

Forecast charts of the Metro Realty Tbk. (MTSM.JK) stock prices in the next 30 days

Price trend prediction of Metro Realty Tbk. (MTSM.JK) stock for the next 30 days

Neutral 10.81%

Metro Realty Tbk. (MTSM.JK) stock profit and loss prediction for the next 30 days

Strong Loss -27.31%

Forecast chart of the highest and lowest Metro Realty Tbk. (MTSM.JK) stock prices in the next 30 days

Users forecasts for Metro Realty Tbk. (MTSM.JK)

What is your prediction?

In this section, you can easily predict without user registration. See also other users predictions.

Metro Realty Tbk. (MTSM.JK) predictions by visitors

Metro Realty Tbk. (MTSM.JK) predictions by visitors

Please enter your name correctly.
Please enter your email correctly
Please enter your text.