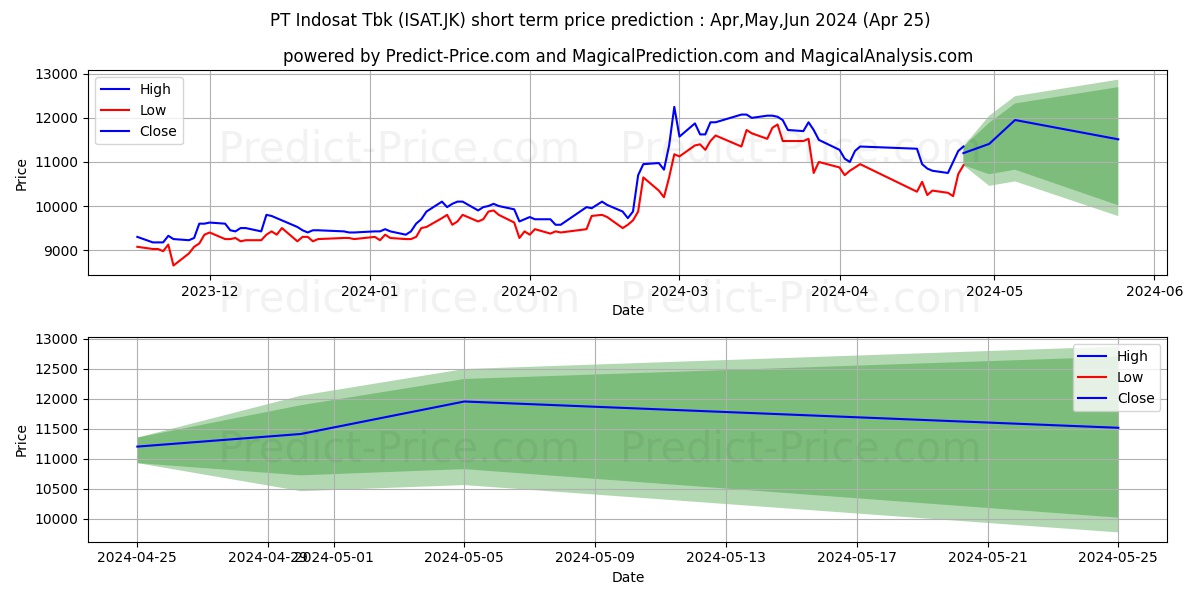
Maximum and minimum Indosat Tbk. short-term price forecast for May,Jun,Jul 2024

Indosat Tbk. stock short term price prediction: May,Jun,Jul 2024|ISAT.JK: 22,892.0881986618041992187500000000000
Period Action Trend Status Action & Trend & Status Ceiling price Floor price Ceiling & Floor
5 Days Neutral Uptrend 23.49% Neutral 1.88% Neutral

Uptrend:23.49%

Neutral:1.88%
12,048.5778570175170898437500000000000 10,457.5759500265121459960937500000000 12,048.5778570175170898437500000000000
10,457.5759500265121459960937500000000
10 Days Neutral Neutral 8.62% Profit 6.71% Neutral

Neutral:8.62%

Profit:6.71%
12,492.1198904514312744140625000000000 10,558.6115914583206176757812500000000 12,492.1198904514312744140625000000000
10,558.6115914583206176757812500000000
30 Days Neutral Neutral -5.8% Neutral 2.8% Neutral

Neutral:-5.8%

Neutral:2.8%
12,867.6342403888702392578125000000000 9,769.7786614298820495605468750000000 12,867.6342403888702392578125000000000
9,769.7786614298820495605468750000000

Indosat Tbk. (ISAT.JK) stock price prediction for the next 5 days on 25 Apr 2024

5-Day prediction shows that the price will grow by 23.49% probability and have a downward trend by 0% probability. Moreover, the probability that Indosat Tbk. (ISAT.JK) price has no a definite trend is 76.51% (The price fluctuation will be experienced). So, Indosat Tbk. (ISAT.JK) price is expected to be neutral in the next 5 days. In the 5-day price prediction, Indosat Tbk. (ISAT.JK) price will reach 11,889.3455505371093750000000000000000 and 10,720.8101272583007812500000000000000 in the best and worst conditions respectively.

Note! All of the predictions are based on daily price changes and none of other external effects such as news, companies’ situations, and different events are not taken into account. So, you really need to consider all factors before you make any decision. (choose the best option by considering all factors) Please pay attention to the predition dates and the validity range of the predicted prices.

The final result of the 5-day Indosat Tbk. (ISAT.JK) predictions demonstrate that:

This prediction will be valid by Apr 30, 2024 if the real price is between 12,483.8128280639648437500000000000000 and 10,184.7696208953857421875000000000000

There will be a neutral trend and meanwhile 1.88% profit. Moreover, the price will be around 11,889.3455505371093750000000000000000. So, it is suggested that take a look at the next days predictions because of the high risk of the trade.

Useful Tips: To make the most informed decisions about investing in Indosat Tbk. (ISAT.JK), we highly recommend visiting the 'MagicalAnalysis' and 'MgicalPrediction' websites. They also provide signals for free. 'MagicalAnalysis' provides signals based on technical analysis and various strategies for free. 'MgicalPrediction' provides signals based on various AI models for free.

Forecast charts of the Indosat Tbk. (ISAT.JK) stock prices in the next 5 days

Price trend prediction of Indosat Tbk. (ISAT.JK) stock for the next 5 days

Neutral 23.49%

Indosat Tbk. (ISAT.JK) stock profit and loss prediction for the next 5 days

Neutral 1.88%

Forecast chart of the highest and lowest Indosat Tbk. (ISAT.JK) stock prices in the next 5 days

Indosat Tbk. (ISAT.JK) stock price prediction for the next 10 days on 25 Apr 2024

10-Day prediction shows that the price will grow by 8.62% probability and have a downward trend by 0% probability. Moreover, the probability that Indosat Tbk. (ISAT.JK) price has no a definite trend is 91.38% (The price fluctuation will be experienced). So, Indosat Tbk. (ISAT.JK) price is expected to be neutral in the next 10 days. In the 10-day price prediction, Indosat Tbk. (ISAT.JK) price will reach 12,327.0257949829101562500000000000000 and 10,824.3889999389648437500000000000000 in the best and worst conditions respectively.

Note! All of the predictions are based on daily price changes and none of other external effects such as news, companies’ situations, and different events are not taken into account. So, you really need to consider all factors before you make any decision. (choose the best option by considering all factors) Please pay attention to the predition dates and the validity range of the predicted prices.

The final result of the 10-day Indosat Tbk. (ISAT.JK) predictions demonstrate that:

This prediction will be valid by May 05, 2024 if the real price is between 12,943.3770847320556640625000000000000 and 10,283.1695499420166015625000000000000

There will be a neutral trend and meanwhile 6.71% profit. Moreover, the price will be around 12,327.0257949829101562500000000000000. So, it is suggested that take a look at the next days predictions because of the high risk of the trade.

Useful Tips: To make the most informed decisions about investing in Indosat Tbk. (ISAT.JK), we highly recommend visiting the 'MagicalAnalysis' and 'MgicalPrediction' websites. They also provide signals for free. 'MagicalAnalysis' provides signals based on technical analysis and various strategies for free. 'MgicalPrediction' provides signals based on various AI models for free.

Forecast charts of the Indosat Tbk. (ISAT.JK) stock prices in the next 10 days

Price trend prediction of Indosat Tbk. (ISAT.JK) stock for the next 10 days

Neutral 8.62%

Indosat Tbk. (ISAT.JK) stock profit and loss prediction for the next 10 days

Neutral 6.71%

Forecast chart of the highest and lowest Indosat Tbk. (ISAT.JK) stock prices in the next 10 days

Indosat Tbk. (ISAT.JK) stock price prediction for the next 30 days on 25 Apr 2024

30-Day prediction shows that the price will grow by 0% probability and have a downward trend by 5.8% probability. Moreover, the probability that Indosat Tbk. (ISAT.JK) price has no a definite trend is 94.2% (The price fluctuation will be experienced). So, Indosat Tbk. (ISAT.JK) price is expected to be neutral in the next 30 days. In the 30-day price prediction, Indosat Tbk. (ISAT.JK) price will reach 12,697.5774002075195312500000000000000 and 9,769.7786614298820495605468750000000 in the best and worst conditions respectively.

Note! All of the predictions are based on daily price changes and none of other external effects such as news, companies’ situations, and different events are not taken into account. So, you really need to consider all factors before you make any decision. (choose the best option by considering all factors) Please pay attention to the predition dates and the validity range of the predicted prices.

The final result of the 30-day Indosat Tbk. (ISAT.JK) predictions demonstrate that:

This prediction will be valid by May 25, 2024 if the real price is between 13,332.4562702178955078125000000000000 and 9,281.2897283583879470825195312500000

There will be a neutral trend and meanwhile 2.8% profit. Moreover, the price will be around 12,697.5774002075195312500000000000000. So, it is suggested that take a look at the next days predictions because of the high risk of the trade.

Useful Tips: To make the most informed decisions about investing in Indosat Tbk. (ISAT.JK), we highly recommend visiting the 'MagicalAnalysis' and 'MgicalPrediction' websites. They also provide signals for free. 'MagicalAnalysis' provides signals based on technical analysis and various strategies for free. 'MgicalPrediction' provides signals based on various AI models for free.

Forecast charts of the Indosat Tbk. (ISAT.JK) stock prices in the next 30 days

Price trend prediction of Indosat Tbk. (ISAT.JK) stock for the next 30 days

Neutral -5.8%

Indosat Tbk. (ISAT.JK) stock profit and loss prediction for the next 30 days

Neutral 2.8%

Forecast chart of the highest and lowest Indosat Tbk. (ISAT.JK) stock prices in the next 30 days

Users forecasts for Indosat Tbk. (ISAT.JK)

What is your prediction?

In this section, you can easily predict without user registration. See also other users predictions.

Indosat Tbk. (ISAT.JK) predictions by visitors

Indosat Tbk. (ISAT.JK) predictions by visitors

Please enter your name correctly.
Please enter your email correctly
Please enter your text.