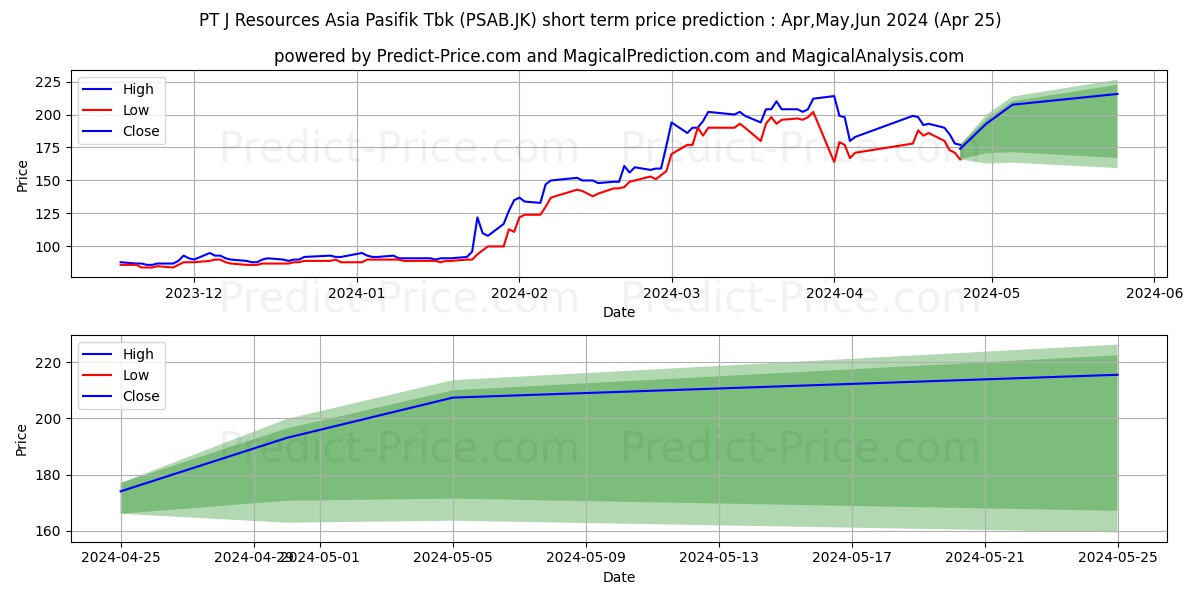
Maximum and minimum J Resources Asia Pasifik Tbk. short-term price forecast for May,Jun,Jul 2024
| Period | Action | Trend | Status | Action & Trend & Status | Ceiling price | Floor price | Ceiling & Floor |
|---|---|---|---|---|---|---|---|
| 5 Days | Buy | Uptrend 49.15% | Profit 10.97% | Buy Uptrend:49.15% Profit:10.97% | 199.8279184341430720905918860808015 | 162.7963698744773921589512610808015 | 199.8279184341430720905918860808015 162.7963698744773921589512610808015 |
| 10 Days | Buy | Uptrend 39.19% | Profit 19.23% | Buy Uptrend:39.19% Profit:19.23% | 213.6849061846733093261718750000000 | 163.5179178714752197265625000000000 | 213.6849061846733093261718750000000 163.5179178714752197265625000000000 |
| 30 Days | Buy | Uptrend 20.47% | Profit 23.91% | Buy Uptrend:20.47% Profit:23.91% | 226.3935746669769173422537278383970 | 159.3662991523742675781250000000000 | 226.3935746669769173422537278383970 159.3662991523742675781250000000000 |
Forecast charts of the J Resources Asia Pasifik Tbk. (PSAB.JK) stock prices in the next 5 days
Price trend prediction of J Resources Asia Pasifik Tbk. (PSAB.JK) stock for the next 5 days
J Resources Asia Pasifik Tbk. (PSAB.JK) stock profit and loss prediction for the next 5 days
Forecast chart of the highest and lowest J Resources Asia Pasifik Tbk. (PSAB.JK) stock prices in the next 5 days
Forecast charts of the J Resources Asia Pasifik Tbk. (PSAB.JK) stock prices in the next 10 days
Price trend prediction of J Resources Asia Pasifik Tbk. (PSAB.JK) stock for the next 10 days
J Resources Asia Pasifik Tbk. (PSAB.JK) stock profit and loss prediction for the next 10 days
Forecast chart of the highest and lowest J Resources Asia Pasifik Tbk. (PSAB.JK) stock prices in the next 10 days
Forecast charts of the J Resources Asia Pasifik Tbk. (PSAB.JK) stock prices in the next 30 days
Price trend prediction of J Resources Asia Pasifik Tbk. (PSAB.JK) stock for the next 30 days
J Resources Asia Pasifik Tbk. (PSAB.JK) stock profit and loss prediction for the next 30 days
Forecast chart of the highest and lowest J Resources Asia Pasifik Tbk. (PSAB.JK) stock prices in the next 30 days
Users forecasts for J Resources Asia Pasifik Tbk. (PSAB.JK)
What is your prediction?
In this section, you can easily predict without user registration. See also other users predictions.
