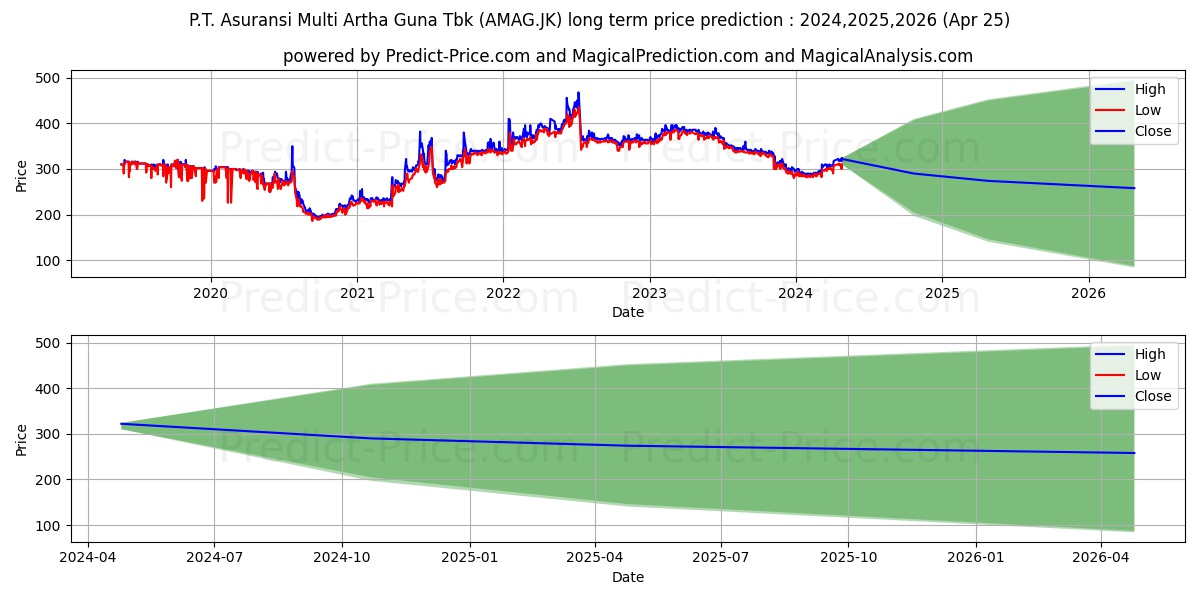
Maximum and minimum Asuransi Multi Artha Guna Tbk. long-term price forecast for 2024,2025,2026

Asuransi Multi Artha Guna Tbk. stock long term price prediction: 2024,2025,2026|AMAG.JK: 374.383
Period Action Trend Status Action & Trend & Status Ceiling price Floor price Ceiling & Floor
6 Months Neutral Uptrend 62.65% Loss -9.95% Neutral

Uptrend:62.65%

Loss:-9.95%
374.3829948425292855063162278383970 184.3650615215301513671875000000000 374.3829948425292855063162278383970
184.3650615215301513671875000000000
1 Year Sell Downtrend -42.28% Loss -14.92% Sell

Downtrend:-42.28%

Loss:-14.92%
413.5744922637939566811837721616030 131.5475922822952270507812500000000 413.5744922637939566811837721616030
131.5475922822952270507812500000000
2 Years Neutral Neutral 0.03% Loss -19.89% Neutral

Neutral:0.03%

Loss:-19.89%
452.7659896850585710126324556767941 78.7301230430603027343750000000000 452.7659896850585710126324556767941
78.7301230430603027343750000000000

Asuransi Multi Artha Guna Tbk. (AMAG.JK) stock price prediction until 25 Oct 2024 (update date: 25 Apr 2024)

Forecast until 25 Oct 2024 shows that the price will grow by 62.65% probability and have a downward trend by 0% probability. Moreover, the probability that Asuransi Multi Artha Guna Tbk. (AMAG.JK) price has no a definite trend is 37.35% (The price fluctuation will be experienced). So, Asuransi Multi Artha Guna Tbk. (AMAG.JK) price is expected to rise in the next 6 Months. In the forecast until 25 Oct 2024, Asuransi Multi Artha Guna Tbk. (AMAG.JK) price will reach 371.8533800125122183999337721616030 and 186.9080278873443603515625000000000 in the best and worst conditions respectively.

Note! All of the predictions are based on daily price changes and none of other external effects such as news, companies’ situations, and different events are not taken into account. So, you really need to consider all factors before you make any decision. (choose the best option by considering all factors) Please pay attention to the predition dates and the validity range of the predicted prices.

The final result of the predictions until 25 Oct 2024 for Asuransi Multi Artha Guna Tbk. (AMAG.JK) shows that:

This prediction will be valid by 25 Oct 2024 if the real price is between 390.4460490131378378464432898908854 and 177.5626264929771309653006028383970

Although, there will be an upward trend, -9.95% loss is observed. Moreover, the price will be around . So, it is suggested that do not buy it because of the high risk of the trade.

Useful Tips: To make the most informed decisions about investing in Asuransi Multi Artha Guna Tbk. (AMAG.JK), we highly recommend visiting the 'MagicalAnalysis' and 'MgicalPrediction' websites. They also provide signals for free. 'MagicalAnalysis' provides signals based on technical analysis and various strategies for free. 'MgicalPrediction' provides signals based on various AI models for free.

Asuransi Multi Artha Guna Tbk. (AMAG.JK) stock price forecast charts until 25 Oct 2024

Asuransi Multi Artha Guna Tbk. (AMAG.JK) stock profit and loss prediction until 25 Oct 2024

Moderate Uptrend 62.65%

Asuransi Multi Artha Guna Tbk. (AMAG.JK) stock profit and loss prediction for the next 25 days

Strong Loss -9.95%

The prediction chart of the highest and lowest price of Asuransi Multi Artha Guna Tbk. (AMAG.JK) stock until 25 Oct 2024 Forecast chart of the highest and lowest 25 Apr 2024

Asuransi Multi Artha Guna Tbk. (AMAG.JK) stock price prediction until 25 Apr 2025 (update date: 25 Apr 2024)

Forecast until 25 Apr 2025 shows that the price will grow by 0% probability and have a downward trend by 42.28% probability. Moreover, the probability that Asuransi Multi Artha Guna Tbk. (AMAG.JK) price has no a definite trend is 57.72% (The price fluctuation will be experienced). So, Asuransi Multi Artha Guna Tbk. (AMAG.JK) price is expected to be neutral in the next 12 Months. In the forecast until 25 Apr 2025, Asuransi Multi Artha Guna Tbk. (AMAG.JK) price will reach 410.7800700187682991781912278383970 and 133.3620418310165405273437500000000 in the best and worst conditions respectively.

Note! All of the predictions are based on daily price changes and none of other external effects such as news, companies’ situations, and different events are not taken into account. So, you really need to consider all factors before you make any decision. (choose the best option by considering all factors) Please pay attention to the predition dates and the validity range of the predicted prices.

The final result of the predictions until 25 Apr 2025 for Asuransi Multi Artha Guna Tbk. (AMAG.JK) shows that:

This prediction will be valid by 25 Apr 2025 if the real price is between 431.3190735197067056105879601091146 and -6.6681020915508275592742393200751

There wil be a neutral trend and meanwhile -14.92% loss. Moreover, the price will be around 133.3620418310165405273437500000000. So, it is suggested that sell it more carefully.

Useful Tips: To make the most informed decisions about investing in Asuransi Multi Artha Guna Tbk. (AMAG.JK), we highly recommend visiting the 'MagicalAnalysis' and 'MgicalPrediction' websites. They also provide signals for free. 'MagicalAnalysis' provides signals based on technical analysis and various strategies for free. 'MgicalPrediction' provides signals based on various AI models for free.

Asuransi Multi Artha Guna Tbk. (AMAG.JK) stock price forecast charts until 25 Apr 2025

Asuransi Multi Artha Guna Tbk. (AMAG.JK) stock profit and loss prediction until 25 Apr 2025

Moderate Downtrend -42.28%

Asuransi Multi Artha Guna Tbk. (AMAG.JK) stock profit and loss prediction for the next 25 days

Strong Loss -14.92%

The prediction chart of the highest and lowest price of Asuransi Multi Artha Guna Tbk. (AMAG.JK) stock until 25 Apr 2025 Forecast chart of the highest and lowest 25 Apr 2024

Asuransi Multi Artha Guna Tbk. (AMAG.JK) stock price prediction until 25 Apr 2026 (update date: 25 Apr 2024)

Forecast until 25 Apr 2026 shows that the price will grow by 0.03% probability and have a downward trend by 0% probability. Moreover, the probability that Asuransi Multi Artha Guna Tbk. (AMAG.JK) price has no a definite trend is 99.97% (The price fluctuation will be experienced). So, Asuransi Multi Artha Guna Tbk. (AMAG.JK) price is expected to be neutral in the next 24 Months. In the forecast until 25 Apr 2026, Asuransi Multi Artha Guna Tbk. (AMAG.JK) price will reach 449.7067600250244367998675443232059 and 78.7301230430603027343750000000000 in the best and worst conditions respectively.

Note! All of the predictions are based on daily price changes and none of other external effects such as news, companies’ situations, and different events are not taken into account. So, you really need to consider all factors before you make any decision. (choose the best option by considering all factors) Please pay attention to the predition dates and the validity range of the predicted prices.

The final result of the predictions until 25 Apr 2026 for Asuransi Multi Artha Guna Tbk. (AMAG.JK) shows that:

This prediction will be valid by 25 Apr 2026 if the real price is between 472.1920980262756302181514911353588 and 74.7936168909072875976562500000000

There wil be a neutral trend and meanwhile -19.89% loss. Moreover, the price will be around 79.8160557746887207031250000000000. So, it is suggested that sell it more carefully.

Useful Tips: To make the most informed decisions about investing in Asuransi Multi Artha Guna Tbk. (AMAG.JK), we highly recommend visiting the 'MagicalAnalysis' and 'MgicalPrediction' websites. They also provide signals for free. 'MagicalAnalysis' provides signals based on technical analysis and various strategies for free. 'MgicalPrediction' provides signals based on various AI models for free.

Asuransi Multi Artha Guna Tbk. (AMAG.JK) stock price forecast charts until 25 Apr 2026

Asuransi Multi Artha Guna Tbk. (AMAG.JK) stock profit and loss prediction until 25 Apr 2026

Neutral 0.03%

Asuransi Multi Artha Guna Tbk. (AMAG.JK) stock profit and loss prediction for the next 25 days

Strong Loss -19.89%

The prediction chart of the highest and lowest price of Asuransi Multi Artha Guna Tbk. (AMAG.JK) stock until 25 Apr 2026 Forecast chart of the highest and lowest 25 Apr 2024

Users forecasts for Asuransi Multi Artha Guna Tbk. (AMAG.JK)

What is your prediction?

In this section, you can easily predict without user registration. See also other users predictions.

Asuransi Multi Artha Guna Tbk. (AMAG.JK) predictions by visitors

Asuransi Multi Artha Guna Tbk. (AMAG.JK) predictions by visitors

Please enter your name correctly.
Please enter your email correctly
Please enter your text.