Maximum and minimum IES Holdings, Inc. short-term price forecast for Apr,May,Jun 2024

IES Holdings, Inc. stock short term price prediction: Apr,May,Jun 2024|IESC: 188.3914699554443359375000000000000
Period Action Trend Status Action & Trend & Status Ceiling price Floor price Ceiling & Floor
5 Days Buy Uptrend 44.23% Profit 7.32% Buy

Uptrend:44.23%

Profit:7.32%
124.8212601329680211392769706435502 109.4874211760360651624068850651383 124.8212601329680211392769706435502
109.4874211760360651624068850651383
10 Days Buy Uptrend 36.62% Profit 13.5% Buy

Uptrend:36.62%

Profit:13.5%
132.5002761976129477261565625667572 108.9778424089206936287155258469284 132.5002761976129477261565625667572
108.9778424089206936287155258469284
30 Days Buy Uptrend 27.29% Profit 30.87% Buy

Uptrend:27.29%

Profit:30.87%
151.3495491727528019509918522089720 110.1607195015303659602068364620209 151.3495491727528019509918522089720
110.1607195015303659602068364620209

IES Holdings, Inc. (IESC) stock price prediction for the next 5 days on 21 Mar 2024

5-Day prediction shows that the price will grow by 44.23% probability and have a downward trend by 0% probability. Moreover, the probability that IES Holdings, Inc. (IESC) price has no a definite trend is 55.77% (The price fluctuation will be experienced). So, IES Holdings, Inc. (IESC) price is expected to be neutral in the next 5 days. In the 5-day price prediction, IES Holdings, Inc. (IESC) price will reach 124.0656867878453368803093326278031 and 114.2278720743790501046532881446183 in the best and worst conditions respectively.

Note! All of the predictions are based on daily price changes and none of other external effects such as news, companies’ situations, and different events are not taken into account. So, you really need to consider all factors before you make any decision. (choose the best option by considering all factors) Please pay attention to the predition dates and the validity range of the predicted prices.

The final result of the 5-day IES Holdings, Inc. (IESC) predictions demonstrate that:

This prediction will be valid by Mar 26, 2024 if the real price is between 130.2689711272375916450982913374901 and 108.5164784706601039943052455782890

There will be a neutral trend and meanwhile 7.32% profit. Moreover, the price will be around 124.0656867878453368803093326278031. So, it is suggested that buy it more carefully.

Useful Tips: To make the most informed decisions about investing in IES Holdings, Inc. (IESC), we highly recommend visiting the 'MagicalAnalysis' and 'MgicalPrediction' websites. They also provide signals for free. 'MagicalAnalysis' provides signals based on technical analysis and various strategies for free. 'MgicalPrediction' provides signals based on various AI models for free.

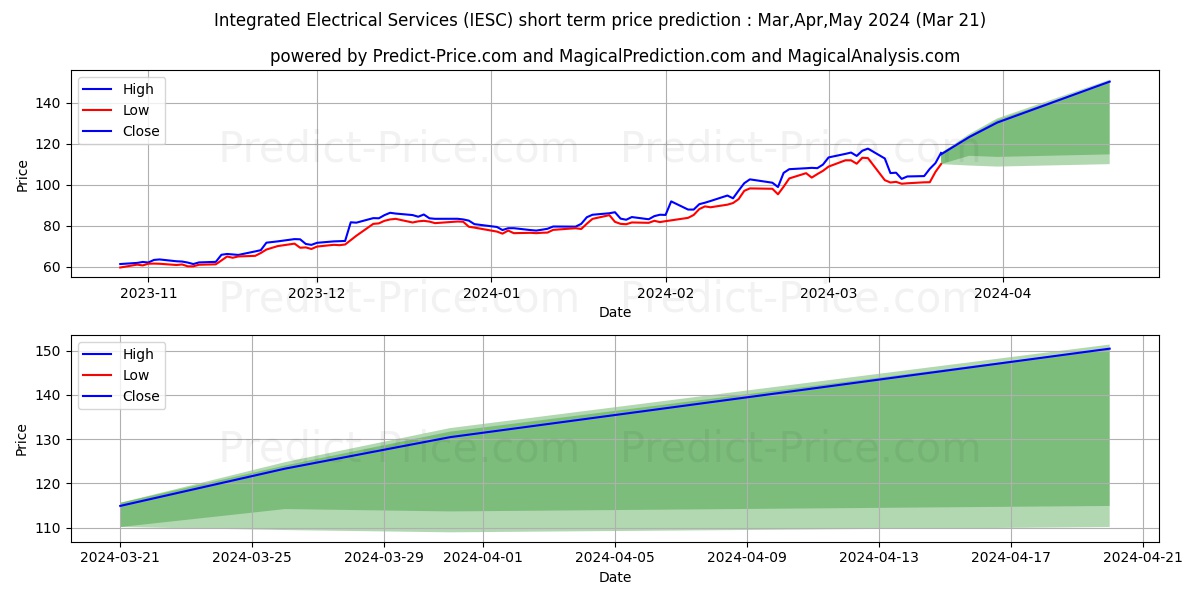
Forecast charts of the IES Holdings, Inc. (IESC) stock prices in the next 5 days

Price trend prediction of IES Holdings, Inc. (IESC) stock for the next 5 days

Moderate Uptrend 44.23%

IES Holdings, Inc. (IESC) stock profit and loss prediction for the next 5 days

Strong Profit 7.32%

Forecast chart of the highest and lowest IES Holdings, Inc. (IESC) stock prices in the next 5 days

IES Holdings, Inc. (IESC) stock price prediction for the next 10 days on 21 Mar 2024

10-Day prediction shows that the price will grow by 36.62% probability and have a downward trend by 0% probability. Moreover, the probability that IES Holdings, Inc. (IESC) price has no a definite trend is 63.38% (The price fluctuation will be experienced). So, IES Holdings, Inc. (IESC) price is expected to be neutral in the next 10 days. In the 10-day price prediction, IES Holdings, Inc. (IESC) price will reach 131.6982199068042973522096872329712 and 113.6962301962834374080557608976960 in the best and worst conditions respectively.

Note! All of the predictions are based on daily price changes and none of other external effects such as news, companies’ situations, and different events are not taken into account. So, you really need to consider all factors before you make any decision. (choose the best option by considering all factors) Please pay attention to the predition dates and the validity range of the predicted prices.

The final result of the 10-day IES Holdings, Inc. (IESC) predictions demonstrate that:

This prediction will be valid by Mar 31, 2024 if the real price is between 138.2831309021445065354782855138183 and 108.0114186864692698009093874134123

There will be a neutral trend and meanwhile 13.5% profit. Moreover, the price will be around 131.6982199068042973522096872329712. So, it is suggested that buy it more carefully.

Useful Tips: To make the most informed decisions about investing in IES Holdings, Inc. (IESC), we highly recommend visiting the 'MagicalAnalysis' and 'MgicalPrediction' websites. They also provide signals for free. 'MagicalAnalysis' provides signals based on technical analysis and various strategies for free. 'MgicalPrediction' provides signals based on various AI models for free.

Forecast charts of the IES Holdings, Inc. (IESC) stock prices in the next 10 days

Price trend prediction of IES Holdings, Inc. (IESC) stock for the next 10 days

Moderate Uptrend 36.62%

IES Holdings, Inc. (IESC) stock profit and loss prediction for the next 10 days

Moderate Profit 13.5%

Forecast chart of the highest and lowest IES Holdings, Inc. (IESC) stock prices in the next 10 days

IES Holdings, Inc. (IESC) stock price prediction for the next 30 days on 21 Mar 2024

30-Day prediction shows that the price will grow by 27.29% probability and have a downward trend by 0% probability. Moreover, the probability that IES Holdings, Inc. (IESC) price has no a definite trend is 72.71% (The price fluctuation will be experienced). So, IES Holdings, Inc. (IESC) price is expected to be neutral in the next 30 days. In the 30-day price prediction, IES Holdings, Inc. (IESC) price will reach 150.4333936634313317881606053560972 and 110.1607195015303659602068364620209 in the best and worst conditions respectively.

Note! All of the predictions are based on daily price changes and none of other external effects such as news, companies’ situations, and different events are not taken into account. So, you really need to consider all factors before you make any decision. (choose the best option by considering all factors) Please pay attention to the predition dates and the validity range of the predicted prices.

The final result of the 30-day IES Holdings, Inc. (IESC) predictions demonstrate that:

This prediction will be valid by Apr 20, 2024 if the real price is between 157.9550633466029125884233508259058 and 104.6526835264538419778546085581183

There will be a neutral trend and meanwhile 30.87% profit. Moreover, the price will be around 150.4333936634313317881606053560972. So, it is suggested that buy it more carefully.

Useful Tips: To make the most informed decisions about investing in IES Holdings, Inc. (IESC), we highly recommend visiting the 'MagicalAnalysis' and 'MgicalPrediction' websites. They also provide signals for free. 'MagicalAnalysis' provides signals based on technical analysis and various strategies for free. 'MgicalPrediction' provides signals based on various AI models for free.

Forecast charts of the IES Holdings, Inc. (IESC) stock prices in the next 30 days

Price trend prediction of IES Holdings, Inc. (IESC) stock for the next 30 days

Neutral 27.29%

IES Holdings, Inc. (IESC) stock profit and loss prediction for the next 30 days

Strong Profit 30.87%

Forecast chart of the highest and lowest IES Holdings, Inc. (IESC) stock prices in the next 30 days

Users forecasts for IES Holdings, Inc. (IESC)

What is your prediction?

In this section, you can easily predict without user registration. See also other users predictions.

IES Holdings, Inc. (IESC) predictions by visitors

IES Holdings, Inc. (IESC) predictions by visitors

Please enter your name correctly.
Please enter your email correctly
Please enter your text.