Note! All of the predictions are based on daily price changes and none of other external effects such as news, companies’ situations, and different events are not taken into account. So, you really need to consider all factors before you make any decision. (choose the best option by considering all factors) Please pay attention to the predition dates and the validity range of the predicted prices.

Maximum and minimum ANABUKI KOSAN INC short-term price forecast for Mar,Apr,May 2026
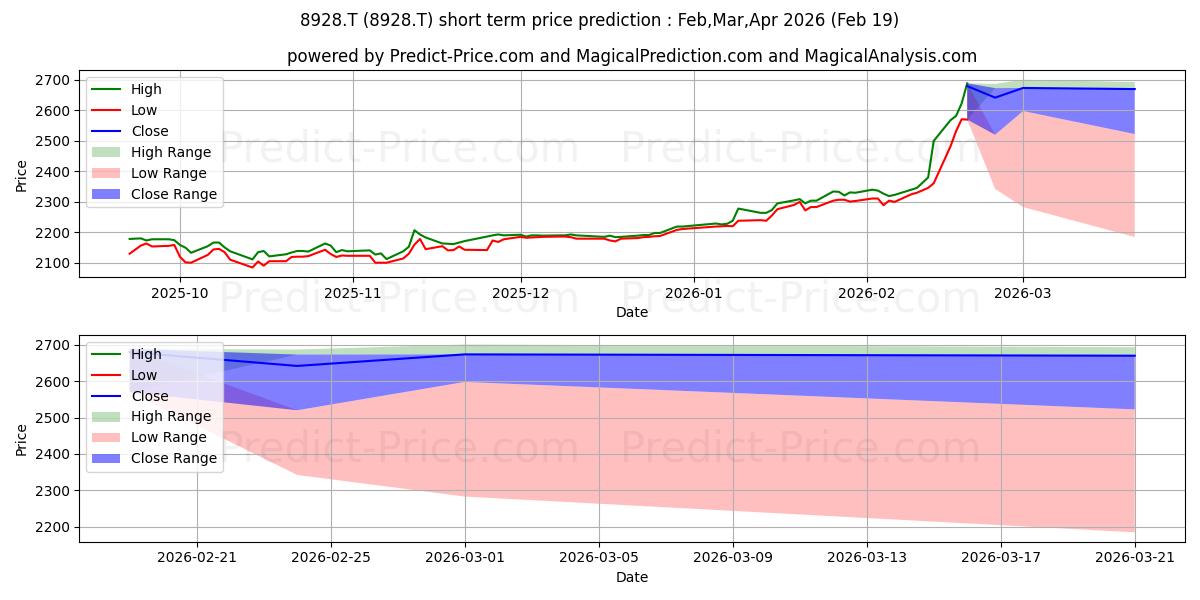
Maximum and minimum ANABUKI KOSAN INC short-term price forecast for Mar,Apr,May 2026
Period Action Trend Status Action & Trend & Status Ceiling price Floor price Ceiling & Floor
5 Days Neutral Uptrend 70.69% Loss -12.6% Neutral

Uptrend:70.69%

Loss:-12.6%
2,687.184542551412050670478492975234985 2,342.421325645023898687213659286499023 2,700.842878937292880436871200799942017
2,342.421325645023898687213659286499023
10 Days Neutral Uptrend 46.28% Loss -14.81% Neutral

Uptrend:46.28%

Loss:-14.81%
2,700.842878937292880436871200799942017 2,282.981773157384850492235273122787476 2,700.842878937292880436871200799942017
2,282.981773157384850492235273122787476
30 Days Neutral Uptrend 31.92% Loss -18.48% Neutral

Uptrend:31.92%

Loss:-18.48%
2,693.431215987046016380190849304199219 2,184.627322759455637424252927303314209 2,693.431215987046016380190849304199219
2,184.627322759455637424252927303314209

Useful Tips: To make the most informed decisions about investing in ANABUKI KOSAN INC (8928.T), we highly recommend visiting the 'MagicalAnalysis' and 'MgicalPrediction' websites. They also provide signals for free. 'MagicalAnalysis' provides signals based on technical analysis and various strategies for free. 'MgicalPrediction' provides signals based on various AI models for free.

ANABUKI KOSAN INC (8928.T) stock price prediction for the next 5 days on 19 Feb 2026

5-Day prediction shows that the price will grow by 70.69% probability and have a downward trend by 0% probability. Moreover, the probability that ANABUKI KOSAN INC (8928.T) price has no a definite trend is 29.31% (The price fluctuation will be experienced). So, ANABUKI KOSAN INC (8928.T) price is expected to rise in the next 5 days. In the 5-day price prediction, ANABUKI KOSAN INC (8928.T) price will reach 2,687.184542551412050670478492975234985 and 2,342.421325645023898687213659286499023 in the best and worst conditions respectively.

The final result of the 5-day ANABUKI KOSAN INC (8928.T) predictions demonstrate that:

This prediction will be valid by Feb 24, 2026 if the real price is between 2,821.543769678982698678737506270408630 and 2,225.300259362772521853912621736526489

Although, there will be an upward trend, -12.6% loss is observed. Moreover, the price will be around 2,642.070215582164109946461394429206848. So, it is suggested that do not buy it because of the high risk of the trade.

Although, there will be an upward trend, -12.6% loss is observed. Moreover, the price will be around 2,642.070215582164109946461394429206848. So, it is suggested that do not buy it because of the high risk of the trade.

Forecast charts of the ANABUKI KOSAN INC (8928.T) stock prices in the next 5 days

Price trend prediction of ANABUKI KOSAN INC (8928.T) stock for the next 5 days

Strong Uptrend 70.69%

ANABUKI KOSAN INC (8928.T) stock profit and loss prediction for the next 5 days

Neutral -12.6%

Forecast chart of the highest and lowest ANABUKI KOSAN INC (8928.T) stock prices in the next 5 days

ANABUKI KOSAN INC (8928.T) stock price prediction for the next 10 days on 19 Feb 2026

10-Day prediction shows that the price will grow by 46.28% probability and have a downward trend by 0% probability. Moreover, the probability that ANABUKI KOSAN INC (8928.T) price has no a definite trend is 53.72% (The price fluctuation will be experienced). So, ANABUKI KOSAN INC (8928.T) price is expected to be neutral in the next 10 days. In the 10-day price prediction, ANABUKI KOSAN INC (8928.T) price will reach 2,700.842878937292880436871200799942017 and 2,282.981773157384850492235273122787476 in the best and worst conditions respectively.

The final result of the 10-day ANABUKI KOSAN INC (8928.T) predictions demonstrate that:

This prediction will be valid by Mar 01, 2026 if the real price is between 2,835.885022884157478983979672193527222 and 2,168.832684499515380593948066234588623

There wil be a neutral trend and meanwhile -14.81% loss. Moreover, the price will be around 2,673.827337142519354529213160276412964. So, it is suggested that sell it more carefully.

Although, there will be an upward trend, -12.6% loss is observed. Moreover, the price will be around 2,642.070215582164109946461394429206848. So, it is suggested that do not buy it because of the high risk of the trade.

Forecast charts of the ANABUKI KOSAN INC (8928.T) stock prices in the next 10 days

Price trend prediction of ANABUKI KOSAN INC (8928.T) stock for the next 10 days

Moderate Uptrend 46.28%

ANABUKI KOSAN INC (8928.T) stock profit and loss prediction for the next 10 days

Neutral -14.81%

Forecast chart of the highest and lowest ANABUKI KOSAN INC (8928.T) stock prices in the next 10 days

ANABUKI KOSAN INC (8928.T) stock price prediction for the next 30 days on 19 Feb 2026

30-Day prediction shows that the price will grow by 31.92% probability and have a downward trend by 0% probability. Moreover, the probability that ANABUKI KOSAN INC (8928.T) price has no a definite trend is 68.08% (The price fluctuation will be experienced). So, ANABUKI KOSAN INC (8928.T) price is expected to be neutral in the next 30 days. In the 30-day price prediction, ANABUKI KOSAN INC (8928.T) price will reach 2,693.431215987046016380190849304199219 and 2,184.627322759455637424252927303314209 in the best and worst conditions respectively.

The final result of the 30-day ANABUKI KOSAN INC (8928.T) predictions demonstrate that:

This prediction will be valid by Mar 21, 2026 if the real price is between 2,828.102776786398408148670569062232971 and 2,075.395956621483037451980635523796082

There wil be a neutral trend and meanwhile -18.48% loss. Moreover, the price will be around 2,670.180481833776411804137751460075378. So, it is suggested that sell it more carefully.

Although, there will be an upward trend, -12.6% loss is observed. Moreover, the price will be around 2,642.070215582164109946461394429206848. So, it is suggested that do not buy it because of the high risk of the trade.

Forecast charts of the ANABUKI KOSAN INC (8928.T) stock prices in the next 30 days

Price trend prediction of ANABUKI KOSAN INC (8928.T) stock for the next 30 days

Moderate Uptrend 31.92%

ANABUKI KOSAN INC (8928.T) stock profit and loss prediction for the next 30 days

Neutral -18.48%

Forecast chart of the highest and lowest ANABUKI KOSAN INC (8928.T) stock prices in the next 30 days

Users forecasts for ANABUKI KOSAN INC (8928.T)

What is your prediction?

In this section, you can easily predict without user registration. See also other users predictions.

ANABUKI KOSAN INC (8928.T) predictions by visitors

ANABUKI KOSAN INC (8928.T) predictions by visitors

Please enter your name correctly.
Please enter your email correctly
Please enter your text.
Live Prediction
×

🔥 Stay Ahead in Trading! 🔥

Watch live AI-powered price predictions on our YouTube channel, @magicalsignal.

📈 24/7 real-time trading insights to help you make smarter moves!