Note! All of the predictions are based on daily price changes and none of other external effects such as news, companies’ situations, and different events are not taken into account. So, you really need to consider all factors before you make any decision. (choose the best option by considering all factors) Please pay attention to the predition dates and the validity range of the predicted prices.

Maximum and minimum Limas Indonesia Makmur Tbk long-term price forecast for 2026,2027,2028
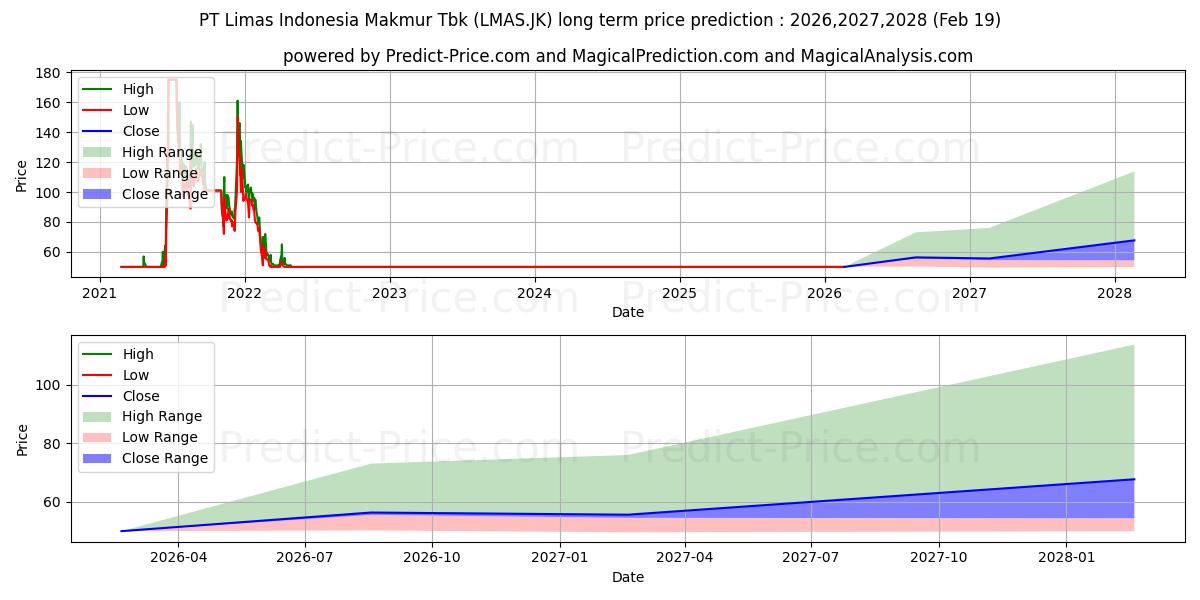
Maximum and minimum Limas Indonesia Makmur Tbk long-term price forecast for 2026,2027,2028
Period Action Trend Status Action & Trend & Status Ceiling price Floor price Ceiling & Floor
6 Months Neutral Neutral -0.26% Profit 46.19% Neutral

Neutral:-0.26%

Profit:46.19%
73.093132495980171370320022106170654 50.268388912434197379752731649205089 73.093132495980171370320022106170654
50.268388912434197379752731649205089
1 Year Neutral Neutral 0.02% Profit 52.07% Neutral

Neutral:0.02%

Profit:52.07%
76.036824619468248442899493966251612 49.600324591406980800911696860566735 76.036824619468248442899493966251612
49.600324591406980800911696860566735
1 Year Neutral Neutral -4.78% Profit 127.55% Neutral

Neutral:-4.78%

Profit:127.55%
113.772567122287611596220813225954771 49.987256508859921666498848935589194 113.772567122287611596220813225954771
49.987256508859921666498848935589194

Useful Tips: To make the most informed decisions about investing in Limas Indonesia Makmur Tbk (LMAS.JK), we highly recommend visiting the 'MagicalAnalysis' and 'MgicalPrediction' websites. They also provide signals for free. 'MagicalAnalysis' provides signals based on technical analysis and various strategies for free. 'MgicalPrediction' provides signals based on various AI models for free.

Limas Indonesia Makmur Tbk (LMAS.JK) stock price prediction until 19 Aug 2026 (update date: 19 Feb 2026)

Forecast until 19 Aug 2026 shows that the price will grow by 0% probability and have a downward trend by 0.26% probability. Moreover, the probability that Limas Indonesia Makmur Tbk (LMAS.JK) price has no a definite trend is 99.74% (The price fluctuation will be experienced). So, Limas Indonesia Makmur Tbk (LMAS.JK) price is expected to be neutral in the next 6 Months. In the forecast until 19 Aug 2026, Limas Indonesia Makmur Tbk (LMAS.JK) price will reach 73.093132495980171370320022106170654 and 50.268388912434197379752731649205089 in the best and worst conditions respectively.

The final result of the predictions until 19 Aug 2026 for Limas Indonesia Makmur Tbk (LMAS.JK) shows that:

This prediction will be valid by 19 Aug 2026 if the real price is between 76.747789120779174254494137130677700 and 47.754969466812489997664670227095485

There will be a neutral trend and meanwhile 46.19% profit. Moreover, the price will be around 56.366187637210572347612469457089901. So, it is suggested that buy it more carefully.

Limas Indonesia Makmur Tbk (LMAS.JK) stock price forecast charts until 19 Aug 2026

Limas Indonesia Makmur Tbk (LMAS.JK) stock profit and loss prediction until 19 Aug 2026

Neutral -0.26%

Limas Indonesia Makmur Tbk (LMAS.JK) stock profit and loss prediction for the next 19 days

Moderate Profit 46.19%

The prediction chart of the highest and lowest price of Limas Indonesia Makmur Tbk (LMAS.JK) stock until 19 Aug 2026 Forecast chart of the highest and lowest 19 Feb 2026

Limas Indonesia Makmur Tbk (LMAS.JK) stock price prediction until 19 Feb 2027 (update date: 19 Feb 2026)

Forecast until 19 Feb 2027 shows that the price will grow by 0.02% probability and have a downward trend by 0% probability. Moreover, the probability that Limas Indonesia Makmur Tbk (LMAS.JK) price has no a definite trend is 99.98% (The price fluctuation will be experienced). So, Limas Indonesia Makmur Tbk (LMAS.JK) price is expected to be neutral in the next 12 Months. In the forecast until 19 Feb 2027, Limas Indonesia Makmur Tbk (LMAS.JK) price will reach 76.036824619468248442899493966251612 and 49.600324591406980800911696860566735 in the best and worst conditions respectively.

The final result of the predictions until 19 Feb 2027 for Limas Indonesia Makmur Tbk (LMAS.JK) shows that:

This prediction will be valid by 19 Feb 2027 if the real price is between 79.838665850441657312330789864063263 and 47.120308361836634958308422937989235

There will be a neutral trend and meanwhile 52.07% profit. Moreover, the price will be around 55.624285860015831417513254564255476. So, it is suggested that buy it more carefully.

Limas Indonesia Makmur Tbk (LMAS.JK) stock price forecast charts until 19 Feb 2027

Limas Indonesia Makmur Tbk (LMAS.JK) stock profit and loss prediction until 19 Feb 2027

Neutral 0.02%

Limas Indonesia Makmur Tbk (LMAS.JK) stock profit and loss prediction for the next 19 days

Moderate Profit 52.07%

The prediction chart of the highest and lowest price of Limas Indonesia Makmur Tbk (LMAS.JK) stock until 19 Feb 2027 Forecast chart of the highest and lowest 19 Feb 2026

Limas Indonesia Makmur Tbk (LMAS.JK) stock price prediction until 19 Feb 2028 (update date: 19 Feb 2026)

Forecast until 19 Feb 2028 shows that the price will grow by 0% probability and have a downward trend by 4.78% probability. Moreover, the probability that Limas Indonesia Makmur Tbk (LMAS.JK) price has no a definite trend is 95.22% (The price fluctuation will be experienced). So, Limas Indonesia Makmur Tbk (LMAS.JK) price is expected to be neutral in the next 24 Months. In the forecast until 19 Feb 2028, Limas Indonesia Makmur Tbk (LMAS.JK) price will reach 113.772567122287611596220813225954771 and 49.987256508859921666498848935589194 in the best and worst conditions respectively.

The final result of the predictions until 19 Feb 2028 for Limas Indonesia Makmur Tbk (LMAS.JK) shows that:

This prediction will be valid by 19 Feb 2028 if the real price is between 119.461195478401990044403646606951952 and 47.487893683416928070073481649160385

There will be a neutral trend and meanwhile 0% profit. Moreover, the price will be around 67.728290595583843014537706039845943. So, it is suggested that buy it more carefully.

Limas Indonesia Makmur Tbk (LMAS.JK) stock price forecast charts until 19 Feb 2028

Limas Indonesia Makmur Tbk (LMAS.JK) stock profit and loss prediction until 19 Feb 2028

Neutral -4.78%

Limas Indonesia Makmur Tbk (LMAS.JK) stock profit and loss prediction for the next 19 days

Strong Profit 127.55%

The prediction chart of the highest and lowest price of Limas Indonesia Makmur Tbk (LMAS.JK) stock until 19 Feb 2028 Forecast chart of the highest and lowest 19 Feb 2026

Users forecasts for Limas Indonesia Makmur Tbk (LMAS.JK)

What is your prediction?

In this section, you can easily predict without user registration. See also other users predictions.

Limas Indonesia Makmur Tbk (LMAS.JK) predictions by visitors

Limas Indonesia Makmur Tbk (LMAS.JK) predictions by visitors

Please enter your name correctly.
Please enter your email correctly
Please enter your text.
Live Prediction
×

🔥 Stay Ahead in Trading! 🔥

Watch live AI-powered price predictions on our YouTube channel, @magicalsignal.

📈 24/7 real-time trading insights to help you make smarter moves!