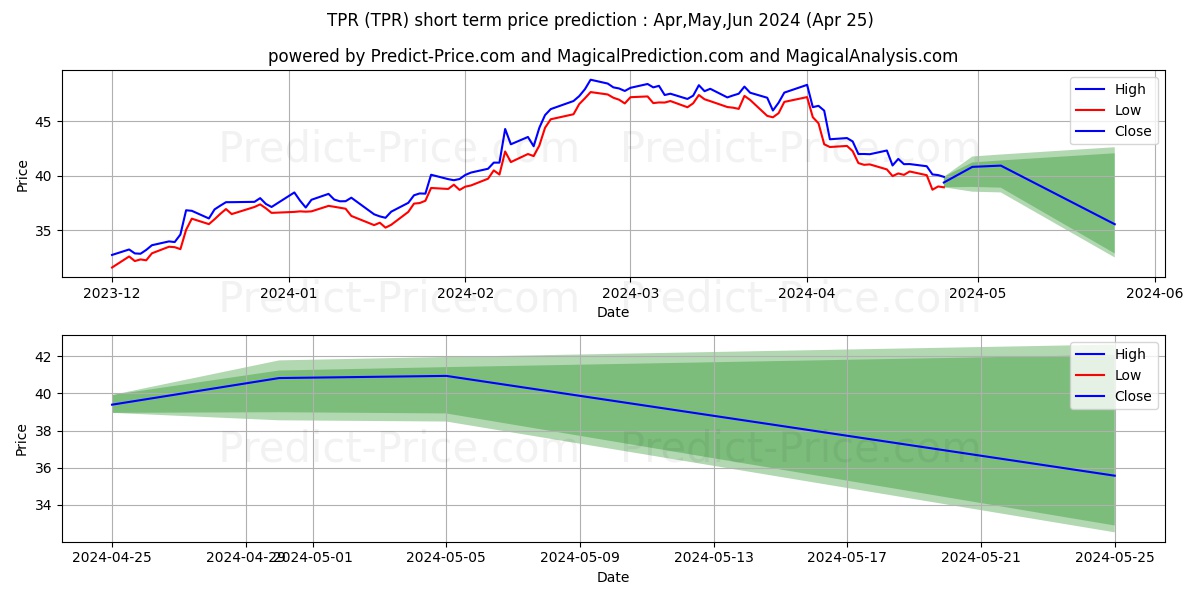
Maximum and minimum Tapestry, Inc. short-term price forecast for Apr,May,Jun 2024

Tapestry, Inc. stock short term price prediction: Apr,May,Jun 2024|TPR: 73.9737829234669277411740040406585
Period Action Trend Status Action & Trend & Status Ceiling price Floor price Ceiling & Floor
5 Days Neutral Neutral 8.71% Neutral 4.9% Neutral

Neutral:8.71%

Neutral:4.9%
51.1473957446331013443341362290084 46.7149509023109672511964163277298 51.1473957446331013443341362290084
46.7149509023109672511964163277298
10 Days Buy Uptrend 43.37% Profit 10.32% Buy

Uptrend:43.37%

Profit:10.32%
53.8028150372338132001459598541260 46.6677925619225817399637890048325 53.8028150372338132001459598541260
46.6677925619225817399637890048325
30 Days Buy Uptrend 15.03% Profit 20.5% Buy

Uptrend:15.03%

Profit:20.5%
58.7378675859232330935810750816017 46.6395264395252979738870635628700 58.7378675859232330935810750816017
46.6395264395252979738870635628700

Tapestry, Inc. (TPR) stock price prediction for the next 5 days on 21 Mar 2024

5-Day prediction shows that the price will grow by 8.71% probability and have a downward trend by 0% probability. Moreover, the probability that Tapestry, Inc. (TPR) price has no a definite trend is 91.29% (The price fluctuation will be experienced). So, Tapestry, Inc. (TPR) price is expected to be neutral in the next 5 days. In the 5-day price prediction, Tapestry, Inc. (TPR) price will reach 51.0624530342956859385594725608826 and 47.4751058856408008068683557212353 in the best and worst conditions respectively.

Note! All of the predictions are based on daily price changes and none of other external effects such as news, companies’ situations, and different events are not taken into account. So, you really need to consider all factors before you make any decision. (choose the best option by considering all factors) Please pay attention to the predition dates and the validity range of the predicted prices.

The final result of the 5-day Tapestry, Inc. (TPR) predictions demonstrate that:

This prediction will be valid by Mar 26, 2024 if the real price is between 53.6155756860104730776583892293274 and 45.1013505913587593454394664149731

There will be a neutral trend and meanwhile 4.9% profit. Moreover, the price will be around 51.0624530342956859385594725608826. So, it is suggested that take a look at the next days predictions because of the high risk of the trade.

Useful Tips: To make the most informed decisions about investing in Tapestry, Inc. (TPR), we highly recommend visiting the 'MagicalAnalysis' and 'MgicalPrediction' websites. They also provide signals for free. 'MagicalAnalysis' provides signals based on technical analysis and various strategies for free. 'MgicalPrediction' provides signals based on various AI models for free.

Forecast charts of the Tapestry, Inc. (TPR) stock prices in the next 5 days

Price trend prediction of Tapestry, Inc. (TPR) stock for the next 5 days

Neutral 8.71%

Tapestry, Inc. (TPR) stock profit and loss prediction for the next 5 days

Moderate Profit 4.9%

Forecast chart of the highest and lowest Tapestry, Inc. (TPR) stock prices in the next 5 days

Tapestry, Inc. (TPR) stock price prediction for the next 10 days on 21 Mar 2024

10-Day prediction shows that the price will grow by 43.37% probability and have a downward trend by 0% probability. Moreover, the probability that Tapestry, Inc. (TPR) price has no a definite trend is 56.63% (The price fluctuation will be experienced). So, Tapestry, Inc. (TPR) price is expected to be neutral in the next 10 days. In the 10-day price prediction, Tapestry, Inc. (TPR) price will reach 53.7134623562906199367716908454895 and 47.4271801753470754192676395177841 in the best and worst conditions respectively.

Note! All of the predictions are based on daily price changes and none of other external effects such as news, companies’ situations, and different events are not taken into account. So, you really need to consider all factors before you make any decision. (choose the best option by considering all factors) Please pay attention to the predition dates and the validity range of the predicted prices.

The final result of the 10-day Tapestry, Inc. (TPR) predictions demonstrate that:

This prediction will be valid by Mar 31, 2024 if the real price is between 56.3991354741051509336102753877640 and 45.0558211665797188061333145014942

There will be a neutral trend and meanwhile 10.32% profit. Moreover, the price will be around 53.7134623562906199367716908454895. So, it is suggested that buy it more carefully.

Useful Tips: To make the most informed decisions about investing in Tapestry, Inc. (TPR), we highly recommend visiting the 'MagicalAnalysis' and 'MgicalPrediction' websites. They also provide signals for free. 'MagicalAnalysis' provides signals based on technical analysis and various strategies for free. 'MgicalPrediction' provides signals based on various AI models for free.

Forecast charts of the Tapestry, Inc. (TPR) stock prices in the next 10 days

Price trend prediction of Tapestry, Inc. (TPR) stock for the next 10 days

Moderate Uptrend 43.37%

Tapestry, Inc. (TPR) stock profit and loss prediction for the next 10 days

Moderate Profit 10.32%

Forecast chart of the highest and lowest Tapestry, Inc. (TPR) stock prices in the next 10 days

Tapestry, Inc. (TPR) stock price prediction for the next 30 days on 21 Mar 2024

30-Day prediction shows that the price will grow by 15.03% probability and have a downward trend by 0% probability. Moreover, the probability that Tapestry, Inc. (TPR) price has no a definite trend is 84.97% (The price fluctuation will be experienced). So, Tapestry, Inc. (TPR) price is expected to be neutral in the next 30 days. In the 30-day price prediction, Tapestry, Inc. (TPR) price will reach 58.6403190480250486871227622032166 and 46.6395264395252979738870635628700 in the best and worst conditions respectively.

Note! All of the predictions are based on daily price changes and none of other external effects such as news, companies’ situations, and different events are not taken into account. So, you really need to consider all factors before you make any decision. (choose the best option by considering all factors) Please pay attention to the predition dates and the validity range of the predicted prices.

The final result of the 30-day Tapestry, Inc. (TPR) predictions demonstrate that:

This prediction will be valid by Apr 20, 2024 if the real price is between 61.5723350004262997003934287931770 and 44.3075501175490344962781819049269

There will be a neutral trend and meanwhile 20.5% profit. Moreover, the price will be around 58.6403190480250486871227622032166. So, it is suggested that buy it more carefully.

Useful Tips: To make the most informed decisions about investing in Tapestry, Inc. (TPR), we highly recommend visiting the 'MagicalAnalysis' and 'MgicalPrediction' websites. They also provide signals for free. 'MagicalAnalysis' provides signals based on technical analysis and various strategies for free. 'MgicalPrediction' provides signals based on various AI models for free.

Forecast charts of the Tapestry, Inc. (TPR) stock prices in the next 30 days

Price trend prediction of Tapestry, Inc. (TPR) stock for the next 30 days

Neutral 15.03%

Tapestry, Inc. (TPR) stock profit and loss prediction for the next 30 days

Strong Profit 20.5%

Forecast chart of the highest and lowest Tapestry, Inc. (TPR) stock prices in the next 30 days

Users forecasts for Tapestry, Inc. (TPR)

What is your prediction?

In this section, you can easily predict without user registration. See also other users predictions.

Tapestry, Inc. (TPR) predictions by visitors

Tapestry, Inc. (TPR) predictions by visitors

Please enter your name correctly.
Please enter your email correctly
Please enter your text.