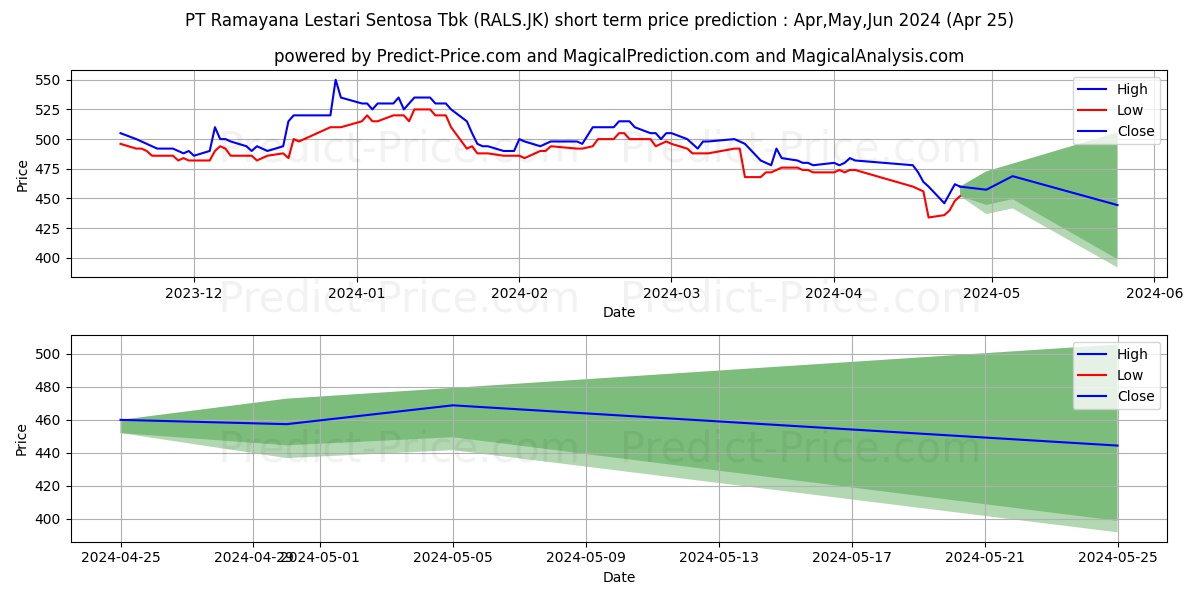
Maximum and minimum Ramayana Lestari Sentosa Tbk. short-term price forecast for Apr,May,Jun 2024

Ramayana Lestari Sentosa Tbk. stock short term price prediction: Apr,May,Jun 2024|RALS.JK: 595.3116626739501953125000000000000
Period Action Trend Status Action & Trend & Status Ceiling price Floor price Ceiling & Floor
5 Days Neutral Neutral 7.09% Neutral 2.81% Neutral

Neutral:7.09%

Neutral:2.81%
508.2443716049194222250662278383970 471.6811959743499755859375000000000 508.2443716049194222250662278383970
471.6811959743499755859375000000000
10 Days Neutral Uptrend 28.6% Neutral 4.69% Neutral

Uptrend:28.6%

Neutral:4.69%
518.3413825035095214843750000000000 470.8653851509094465654925443232059 518.3413825035095214843750000000000
470.8653851509094465654925443232059
30 Days Neutral Neutral 8.35% Profit 11.24% Neutral

Neutral:8.35%

Profit:11.24%
567.7068720817566145342425443232059 454.3213284015655517578125000000000 567.7068720817566145342425443232059
454.3213284015655517578125000000000

Ramayana Lestari Sentosa Tbk. (RALS.JK) stock price prediction for the next 5 days on 21 Mar 2024

5-Day prediction shows that the price will grow by 7.09% probability and have a downward trend by 0% probability. Moreover, the probability that Ramayana Lestari Sentosa Tbk. (RALS.JK) price has no a definite trend is 92.91% (The price fluctuation will be experienced). So, Ramayana Lestari Sentosa Tbk. (RALS.JK) price is expected to be neutral in the next 5 days. In the 5-day price prediction, Ramayana Lestari Sentosa Tbk. (RALS.JK) price will reach 497.9142014503478890219412278383970 and 479.6420600414276123046875000000000 in the best and worst conditions respectively.

Note! All of the predictions are based on daily price changes and none of other external effects such as news, companies’ situations, and different events are not taken into account. So, you really need to consider all factors before you make any decision. (choose the best option by considering all factors) Please pay attention to the predition dates and the validity range of the predicted prices.

The final result of the 5-day Ramayana Lestari Sentosa Tbk. (RALS.JK) predictions demonstrate that:

This prediction will be valid by Mar 26, 2024 if the real price is between 522.8099115228652635778416879475117 and 455.6599570393562430581368971616030

There will be a neutral trend and meanwhile 2.81% profit. Moreover, the price will be around 497.9142014503478890219412278383970. So, it is suggested that take a look at the next days predictions because of the high risk of the trade.

Useful Tips: To make the most informed decisions about investing in Ramayana Lestari Sentosa Tbk. (RALS.JK), we highly recommend visiting the 'MagicalAnalysis' and 'MgicalPrediction' websites. They also provide signals for free. 'MagicalAnalysis' provides signals based on technical analysis and various strategies for free. 'MgicalPrediction' provides signals based on various AI models for free.

Forecast charts of the Ramayana Lestari Sentosa Tbk. (RALS.JK) stock prices in the next 5 days

Price trend prediction of Ramayana Lestari Sentosa Tbk. (RALS.JK) stock for the next 5 days

Neutral 7.09%

Ramayana Lestari Sentosa Tbk. (RALS.JK) stock profit and loss prediction for the next 5 days

Neutral 2.81%

Forecast chart of the highest and lowest Ramayana Lestari Sentosa Tbk. (RALS.JK) stock prices in the next 5 days

Ramayana Lestari Sentosa Tbk. (RALS.JK) stock price prediction for the next 10 days on 21 Mar 2024

10-Day prediction shows that the price will grow by 28.6% probability and have a downward trend by 0% probability. Moreover, the probability that Ramayana Lestari Sentosa Tbk. (RALS.JK) price has no a definite trend is 71.4% (The price fluctuation will be experienced). So, Ramayana Lestari Sentosa Tbk. (RALS.JK) price is expected to be neutral in the next 10 days. In the 10-day price prediction, Ramayana Lestari Sentosa Tbk. (RALS.JK) price will reach 507.8059885501861572265625000000000 and 478.8124802589416617593087721616030 in the best and worst conditions respectively.

Note! All of the predictions are based on daily price changes and none of other external effects such as news, companies’ situations, and different events are not taken into account. So, you really need to consider all factors before you make any decision. (choose the best option by considering all factors) Please pay attention to the predition dates and the validity range of the predicted prices.

The final result of the 10-day Ramayana Lestari Sentosa Tbk. (RALS.JK) predictions demonstrate that:

This prediction will be valid by Mar 31, 2024 if the real price is between 533.1962879776954196131555363535881 and 454.8718562459945928821980487555265

There will be a neutral trend and meanwhile 4.69% profit. Moreover, the price will be around 507.8059885501861572265625000000000. So, it is suggested that take a look at the next days predictions because of the high risk of the trade.

Useful Tips: To make the most informed decisions about investing in Ramayana Lestari Sentosa Tbk. (RALS.JK), we highly recommend visiting the 'MagicalAnalysis' and 'MgicalPrediction' websites. They also provide signals for free. 'MagicalAnalysis' provides signals based on technical analysis and various strategies for free. 'MgicalPrediction' provides signals based on various AI models for free.

Forecast charts of the Ramayana Lestari Sentosa Tbk. (RALS.JK) stock prices in the next 10 days

Price trend prediction of Ramayana Lestari Sentosa Tbk. (RALS.JK) stock for the next 10 days

Neutral 28.6%

Ramayana Lestari Sentosa Tbk. (RALS.JK) stock profit and loss prediction for the next 10 days

Neutral 4.69%

Forecast chart of the highest and lowest Ramayana Lestari Sentosa Tbk. (RALS.JK) stock prices in the next 10 days

Ramayana Lestari Sentosa Tbk. (RALS.JK) stock price prediction for the next 30 days on 21 Mar 2024

30-Day prediction shows that the price will grow by 8.35% probability and have a downward trend by 0% probability. Moreover, the probability that Ramayana Lestari Sentosa Tbk. (RALS.JK) price has no a definite trend is 91.65% (The price fluctuation will be experienced). So, Ramayana Lestari Sentosa Tbk. (RALS.JK) price is expected to be neutral in the next 30 days. In the 30-day price prediction, Ramayana Lestari Sentosa Tbk. (RALS.JK) price will reach 556.1681145191192854326800443232059 and 454.3213284015655517578125000000000 in the best and worst conditions respectively.

Note! All of the predictions are based on daily price changes and none of other external effects such as news, companies’ situations, and different events are not taken into account. So, you really need to consider all factors before you make any decision. (choose the best option by considering all factors) Please pay attention to the predition dates and the validity range of the predicted prices.

The final result of the 30-day Ramayana Lestari Sentosa Tbk. (RALS.JK) predictions demonstrate that:

This prediction will be valid by Apr 20, 2024 if the real price is between 583.9765202450752212826046161353588 and 431.6052619814872741699218750000000

There will be a neutral trend and meanwhile 11.24% profit. Moreover, the price will be around 556.1681145191192854326800443232059. So, it is suggested that take a look at the next days predictions because of the high risk of the trade.

Useful Tips: To make the most informed decisions about investing in Ramayana Lestari Sentosa Tbk. (RALS.JK), we highly recommend visiting the 'MagicalAnalysis' and 'MgicalPrediction' websites. They also provide signals for free. 'MagicalAnalysis' provides signals based on technical analysis and various strategies for free. 'MgicalPrediction' provides signals based on various AI models for free.

Forecast charts of the Ramayana Lestari Sentosa Tbk. (RALS.JK) stock prices in the next 30 days

Price trend prediction of Ramayana Lestari Sentosa Tbk. (RALS.JK) stock for the next 30 days

Neutral 8.35%

Ramayana Lestari Sentosa Tbk. (RALS.JK) stock profit and loss prediction for the next 30 days

Moderate Profit 11.24%

Forecast chart of the highest and lowest Ramayana Lestari Sentosa Tbk. (RALS.JK) stock prices in the next 30 days

Users forecasts for Ramayana Lestari Sentosa Tbk. (RALS.JK)

What is your prediction?

In this section, you can easily predict without user registration. See also other users predictions.

Ramayana Lestari Sentosa Tbk. (RALS.JK) predictions by visitors

Ramayana Lestari Sentosa Tbk. (RALS.JK) predictions by visitors

Please enter your name correctly.
Please enter your email correctly
Please enter your text.