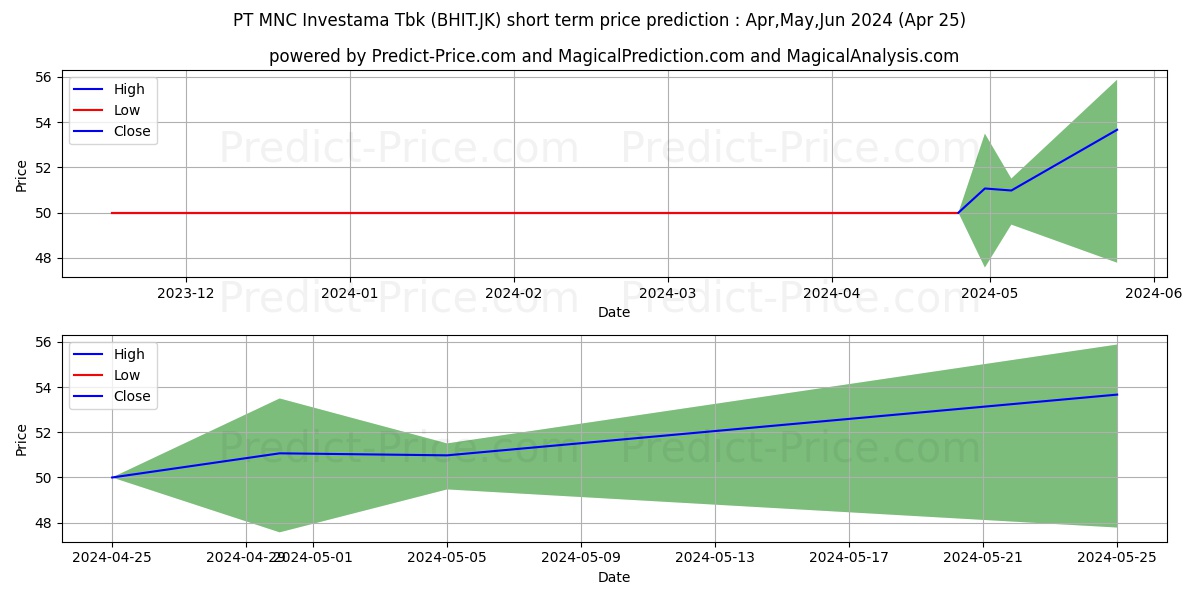
Maximum and minimum MNC Investama Tbk. short-term price forecast for May,Jun,Jul 2024

MNC Investama Tbk. stock short term price prediction: May,Jun,Jul 2024|BHIT.JK: 59.0465402603149414062500000000000
Period Action Trend Status Action & Trend & Status Ceiling price Floor price Ceiling & Floor
5 Days Buy Uptrend 83.4% Profit 5.02% Buy

Uptrend:83.4%

Profit:5.02%
54.3086600303649902343750000000000 48.2004299759864807128906250000000 54.3086600303649902343750000000000
48.2004299759864807128906250000000
10 Days Neutral Uptrend 78.99% Neutral 3.44% Neutral

Uptrend:78.99%

Neutral:3.44%
52.7879655361175537109375000000000 48.9310669898986816406250000000000 52.7879655361175537109375000000000
48.9310669898986816406250000000000
30 Days Neutral Uptrend 71.22% Neutral 7.17% Neutral

Uptrend:71.22%

Neutral:7.17%
55.2508962154388427734375000000000 48.3356714248657226562500000000000 55.2508962154388427734375000000000
48.3356714248657226562500000000000

MNC Investama Tbk. (BHIT.JK) stock price prediction for the next 5 days on 18 Apr 2024

5-Day prediction shows that the price will grow by 83.4% probability and have a downward trend by 0% probability. Moreover, the probability that MNC Investama Tbk. (BHIT.JK) price has no a definite trend is 16.6% (The price fluctuation will be experienced). So, MNC Investama Tbk. (BHIT.JK) price is expected to rise in the next 5 days. In the 5-day price prediction, MNC Investama Tbk. (BHIT.JK) price will reach 54.3086600303649902343750000000000 and 48.2004299759864807128906250000000 in the best and worst conditions respectively.

Note! All of the predictions are based on daily price changes and none of other external effects such as news, companies’ situations, and different events are not taken into account. So, you really need to consider all factors before you make any decision. (choose the best option by considering all factors) Please pay attention to the predition dates and the validity range of the predicted prices.

The final result of the 5-day MNC Investama Tbk. (BHIT.JK) predictions demonstrate that:

This prediction will be valid by Apr 23, 2024 if the real price is between 57.0240930318832397460937500000000 and 45.7904084771871566772460937500000

There will be an upward trend and 5.02% profit. Moreover, the price will be around 54.3086600303649902343750000000000. So, it is suggested that buy it.

Useful Tips: To make the most informed decisions about investing in MNC Investama Tbk. (BHIT.JK), we highly recommend visiting the 'MagicalAnalysis' and 'MgicalPrediction' websites. They also provide signals for free. 'MagicalAnalysis' provides signals based on technical analysis and various strategies for free. 'MgicalPrediction' provides signals based on various AI models for free.

Forecast charts of the MNC Investama Tbk. (BHIT.JK) stock prices in the next 5 days

Price trend prediction of MNC Investama Tbk. (BHIT.JK) stock for the next 5 days

Strong Uptrend 83.4%

MNC Investama Tbk. (BHIT.JK) stock profit and loss prediction for the next 5 days

Moderate Profit 5.02%

Forecast chart of the highest and lowest MNC Investama Tbk. (BHIT.JK) stock prices in the next 5 days

MNC Investama Tbk. (BHIT.JK) stock price prediction for the next 10 days on 18 Apr 2024

10-Day prediction shows that the price will grow by 78.99% probability and have a downward trend by 0% probability. Moreover, the probability that MNC Investama Tbk. (BHIT.JK) price has no a definite trend is 21.01% (The price fluctuation will be experienced). So, MNC Investama Tbk. (BHIT.JK) price is expected to rise in the next 10 days. In the 10-day price prediction, MNC Investama Tbk. (BHIT.JK) price will reach 52.7879655361175537109375000000000 and 48.9310669898986816406250000000000 in the best and worst conditions respectively.

Note! All of the predictions are based on daily price changes and none of other external effects such as news, companies’ situations, and different events are not taken into account. So, you really need to consider all factors before you make any decision. (choose the best option by considering all factors) Please pay attention to the predition dates and the validity range of the predicted prices.

The final result of the 10-day MNC Investama Tbk. (BHIT.JK) predictions demonstrate that:

This prediction will be valid by Apr 28, 2024 if the real price is between 55.4273638129234313964843750000000 and 46.4845136404037475585937500000000

There will be an upward trend and 3.44% profit. Moreover, the price will be around 52.7879655361175537109375000000000. So, it is suggested that buy it more carefully.

Useful Tips: To make the most informed decisions about investing in MNC Investama Tbk. (BHIT.JK), we highly recommend visiting the 'MagicalAnalysis' and 'MgicalPrediction' websites. They also provide signals for free. 'MagicalAnalysis' provides signals based on technical analysis and various strategies for free. 'MgicalPrediction' provides signals based on various AI models for free.

Forecast charts of the MNC Investama Tbk. (BHIT.JK) stock prices in the next 10 days

Price trend prediction of MNC Investama Tbk. (BHIT.JK) stock for the next 10 days

Strong Uptrend 78.99%

MNC Investama Tbk. (BHIT.JK) stock profit and loss prediction for the next 10 days

Neutral 3.44%

Forecast chart of the highest and lowest MNC Investama Tbk. (BHIT.JK) stock prices in the next 10 days

MNC Investama Tbk. (BHIT.JK) stock price prediction for the next 30 days on 18 Apr 2024

30-Day prediction shows that the price will grow by 71.22% probability and have a downward trend by 0% probability. Moreover, the probability that MNC Investama Tbk. (BHIT.JK) price has no a definite trend is 28.78% (The price fluctuation will be experienced). So, MNC Investama Tbk. (BHIT.JK) price is expected to rise in the next 30 days. In the 30-day price prediction, MNC Investama Tbk. (BHIT.JK) price will reach 55.2508962154388427734375000000000 and 48.3356714248657226562500000000000 in the best and worst conditions respectively.

Note! All of the predictions are based on daily price changes and none of other external effects such as news, companies’ situations, and different events are not taken into account. So, you really need to consider all factors before you make any decision. (choose the best option by considering all factors) Please pay attention to the predition dates and the validity range of the predicted prices.

The final result of the 30-day MNC Investama Tbk. (BHIT.JK) predictions demonstrate that:

This prediction will be valid by May 18, 2024 if the real price is between 58.0134410262107849121093750000000 and 45.9188878536224365234375000000000

There will be an upward trend and 7.17% profit. Moreover, the price will be around 55.2508962154388427734375000000000. So, it is suggested that buy it more carefully.

Useful Tips: To make the most informed decisions about investing in MNC Investama Tbk. (BHIT.JK), we highly recommend visiting the 'MagicalAnalysis' and 'MgicalPrediction' websites. They also provide signals for free. 'MagicalAnalysis' provides signals based on technical analysis and various strategies for free. 'MgicalPrediction' provides signals based on various AI models for free.

Forecast charts of the MNC Investama Tbk. (BHIT.JK) stock prices in the next 30 days

Price trend prediction of MNC Investama Tbk. (BHIT.JK) stock for the next 30 days

Strong Uptrend 71.22%

MNC Investama Tbk. (BHIT.JK) stock profit and loss prediction for the next 30 days

Neutral 7.17%

Forecast chart of the highest and lowest MNC Investama Tbk. (BHIT.JK) stock prices in the next 30 days

Users forecasts for MNC Investama Tbk. (BHIT.JK)

What is your prediction?

In this section, you can easily predict without user registration. See also other users predictions.

MNC Investama Tbk. (BHIT.JK) predictions by visitors

MNC Investama Tbk. (BHIT.JK) predictions by visitors

Please enter your name correctly.
Please enter your email correctly
Please enter your text.