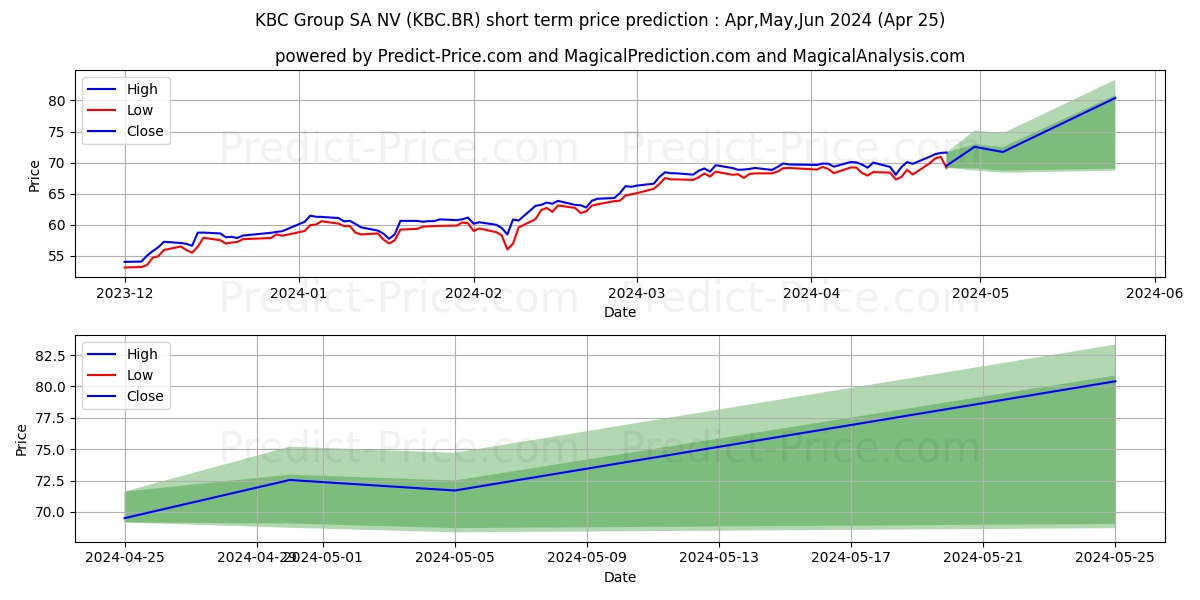
Maximum and minimum KBC Group SA NV short-term price forecast for May,Jun,Jul 2024

KBC Group SA NV stock short term price prediction: May,Jun,Jul 2024|KBC.BR: 110.90
Period Action Trend Status Action & Trend & Status Ceiling price Floor price Ceiling & Floor
5 Days Neutral Uptrend 51.91% Neutral 3.64% Neutral

Uptrend:51.91%

Neutral:3.64%
72.91 68.56 72.91
68.56
10 Days Buy Uptrend 44.89% Profit 6.15% Buy

Uptrend:44.89%

Profit:6.15%
75.23 68.02 75.23
68.02
30 Days Buy Uptrend 22.45% Profit 14.22% Buy

Uptrend:22.45%

Profit:14.22%
79.97 68.91 79.97
68.91

KBC Group SA NV (KBC.BR) stock price prediction for the next 5 days on 18 Apr 2024

5-Day prediction shows that the price will grow by 51.91% probability and have a downward trend by 0% probability. Moreover, the probability that KBC Group SA NV (KBC.BR) price has no a definite trend is 48.09% (The price fluctuation will be experienced). So, KBC Group SA NV (KBC.BR) price is expected to rise in the next 5 days. In the 5-day price prediction, KBC Group SA NV (KBC.BR) price will reach 72.83 and 69.72 in the best and worst conditions respectively.

Note! All of the predictions are based on daily price changes and none of other external effects such as news, companies’ situations, and different events are not taken into account. So, you really need to consider all factors before you make any decision. (choose the best option by considering all factors) Please pay attention to the predition dates and the validity range of the predicted prices.

The final result of the 5-day KBC Group SA NV (KBC.BR) predictions demonstrate that:

This prediction will be valid by Apr 23, 2024 if the real price is between 76.47 and 66.23

There will be an upward trend and 3.64% profit. Moreover, the price will be around 72.83. So, it is suggested that buy it more carefully.

Useful Tips: To make the most informed decisions about investing in KBC Group SA NV (KBC.BR), we highly recommend visiting the 'MagicalAnalysis' and 'MgicalPrediction' websites. They also provide signals for free. 'MagicalAnalysis' provides signals based on technical analysis and various strategies for free. 'MgicalPrediction' provides signals based on various AI models for free.

Forecast charts of the KBC Group SA NV (KBC.BR) stock prices in the next 5 days

Price trend prediction of KBC Group SA NV (KBC.BR) stock for the next 5 days

Moderate Uptrend 51.91%

KBC Group SA NV (KBC.BR) stock profit and loss prediction for the next 5 days

Moderate Profit 3.64%

Forecast chart of the highest and lowest KBC Group SA NV (KBC.BR) stock prices in the next 5 days

KBC Group SA NV (KBC.BR) stock price prediction for the next 10 days on 18 Apr 2024

10-Day prediction shows that the price will grow by 44.89% probability and have a downward trend by 0% probability. Moreover, the probability that KBC Group SA NV (KBC.BR) price has no a definite trend is 55.11% (The price fluctuation will be experienced). So, KBC Group SA NV (KBC.BR) price is expected to be neutral in the next 10 days. In the 10-day price prediction, KBC Group SA NV (KBC.BR) price will reach 75.14 and 69.16 in the best and worst conditions respectively.

Note! All of the predictions are based on daily price changes and none of other external effects such as news, companies’ situations, and different events are not taken into account. So, you really need to consider all factors before you make any decision. (choose the best option by considering all factors) Please pay attention to the predition dates and the validity range of the predicted prices.

The final result of the 10-day KBC Group SA NV (KBC.BR) predictions demonstrate that:

This prediction will be valid by Apr 28, 2024 if the real price is between 78.90 and 65.70

There will be a neutral trend and meanwhile 6.15% profit. Moreover, the price will be around 75.14. So, it is suggested that take a look at the next days predictions because of the high risk of the trade.

Useful Tips: To make the most informed decisions about investing in KBC Group SA NV (KBC.BR), we highly recommend visiting the 'MagicalAnalysis' and 'MgicalPrediction' websites. They also provide signals for free. 'MagicalAnalysis' provides signals based on technical analysis and various strategies for free. 'MgicalPrediction' provides signals based on various AI models for free.

Forecast charts of the KBC Group SA NV (KBC.BR) stock prices in the next 10 days

Price trend prediction of KBC Group SA NV (KBC.BR) stock for the next 10 days

Moderate Uptrend 44.89%

KBC Group SA NV (KBC.BR) stock profit and loss prediction for the next 10 days

Neutral 6.15%

Forecast chart of the highest and lowest KBC Group SA NV (KBC.BR) stock prices in the next 10 days

KBC Group SA NV (KBC.BR) stock price prediction for the next 30 days on 18 Apr 2024

30-Day prediction shows that the price will grow by 22.45% probability and have a downward trend by 0% probability. Moreover, the probability that KBC Group SA NV (KBC.BR) price has no a definite trend is 77.55% (The price fluctuation will be experienced). So, KBC Group SA NV (KBC.BR) price is expected to be neutral in the next 30 days. In the 30-day price prediction, KBC Group SA NV (KBC.BR) price will reach 79.88 and 68.91 in the best and worst conditions respectively.

Note! All of the predictions are based on daily price changes and none of other external effects such as news, companies’ situations, and different events are not taken into account. So, you really need to consider all factors before you make any decision. (choose the best option by considering all factors) Please pay attention to the predition dates and the validity range of the predicted prices.

The final result of the 30-day KBC Group SA NV (KBC.BR) predictions demonstrate that:

This prediction will be valid by May 18, 2024 if the real price is between 83.87 and 65.47

There will be a neutral trend and meanwhile 14.22% profit. Moreover, the price will be around 79.88. So, it is suggested that take a look at the next days predictions because of the high risk of the trade.

Useful Tips: To make the most informed decisions about investing in KBC Group SA NV (KBC.BR), we highly recommend visiting the 'MagicalAnalysis' and 'MgicalPrediction' websites. They also provide signals for free. 'MagicalAnalysis' provides signals based on technical analysis and various strategies for free. 'MgicalPrediction' provides signals based on various AI models for free.

Forecast charts of the KBC Group SA NV (KBC.BR) stock prices in the next 30 days

Price trend prediction of KBC Group SA NV (KBC.BR) stock for the next 30 days

Neutral 22.45%

KBC Group SA NV (KBC.BR) stock profit and loss prediction for the next 30 days

Moderate Profit 14.22%

Forecast chart of the highest and lowest KBC Group SA NV (KBC.BR) stock prices in the next 30 days

Users forecasts for KBC Group SA NV (KBC.BR)

What is your prediction?

In this section, you can easily predict without user registration. See also other users predictions.

KBC Group SA NV (KBC.BR) predictions by visitors

KBC Group SA NV (KBC.BR) predictions by visitors

Please enter your name correctly.
Please enter your email correctly
Please enter your text.